Build a strategy that beats Buy and hold
In this article I am going to explain how to create a long-only trading strategy that beats Buy & Hold. The goal of the strategy is to take very little risk, and to only buy & sell (only long with no leverage), while performing better than simply holding the asset.
Understanding Buy & Hold
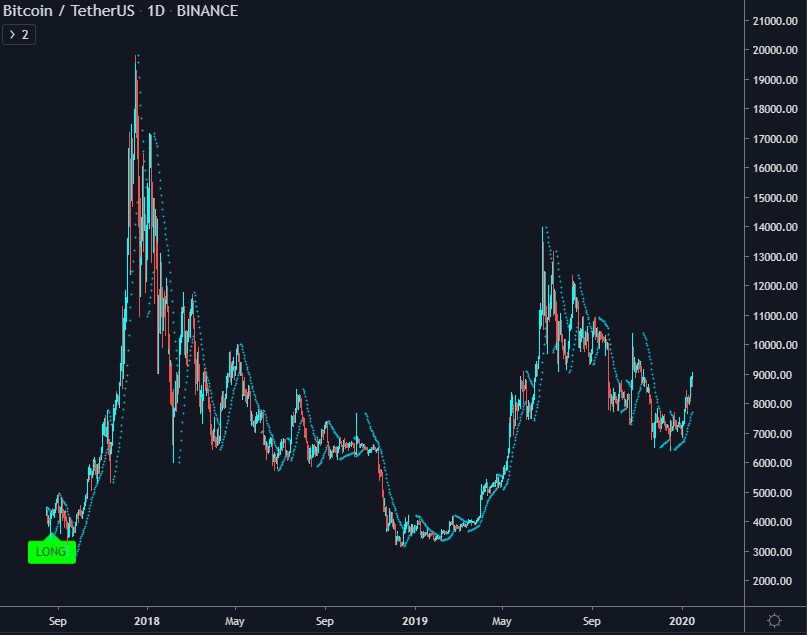
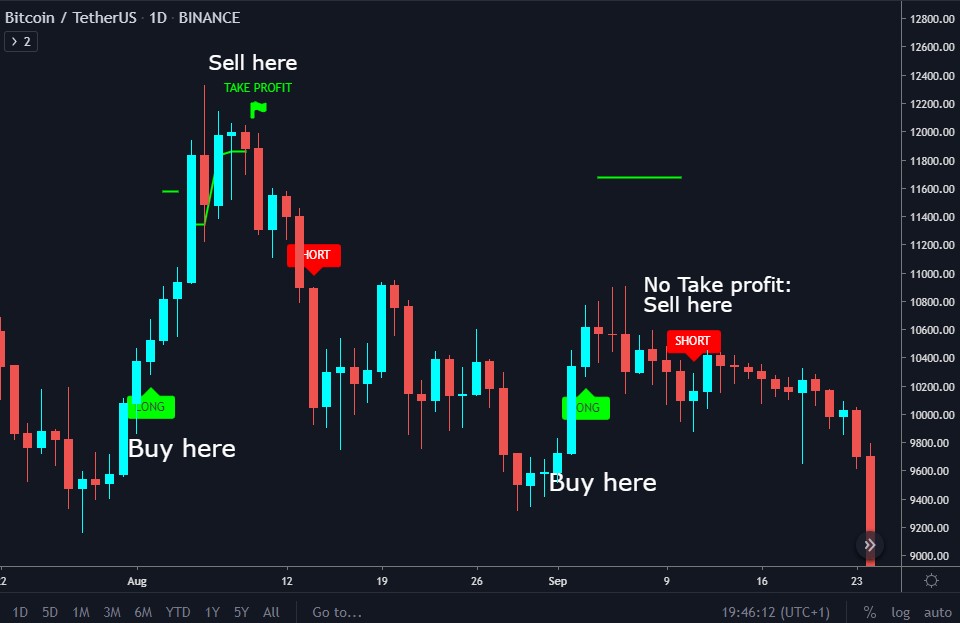
What we call the Buy & Hold is the in fact the Buy & Hold return we would get if we simply bought the asset at the beginning of the backtest period, as shown in this picture of the Bitcoin chart.
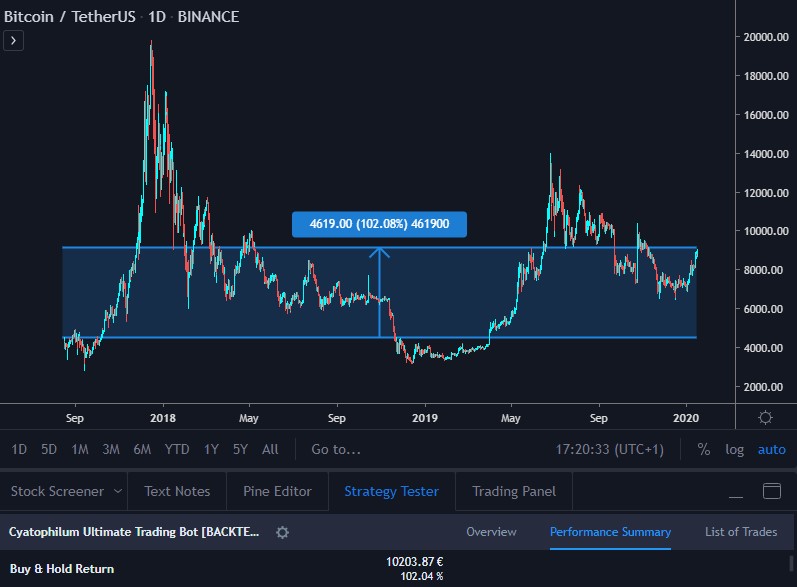
The Buy & hold return here is around 100% of our inital capital, which means we would have doubled our investment buy simply buying in August 2018 and selling today, in january 2020.
To goal now is to find a strategy that performs better than this Buy & Hold return.
Creating the Strategy
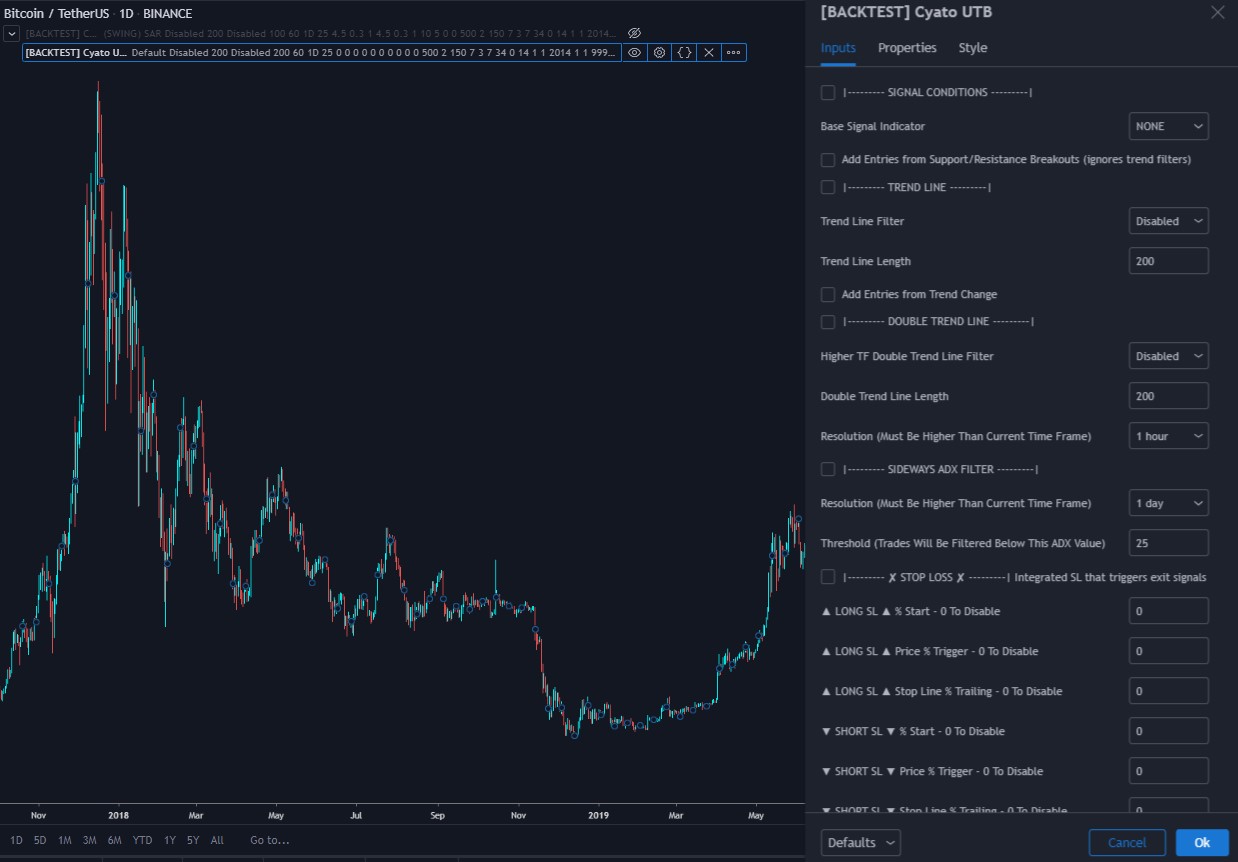
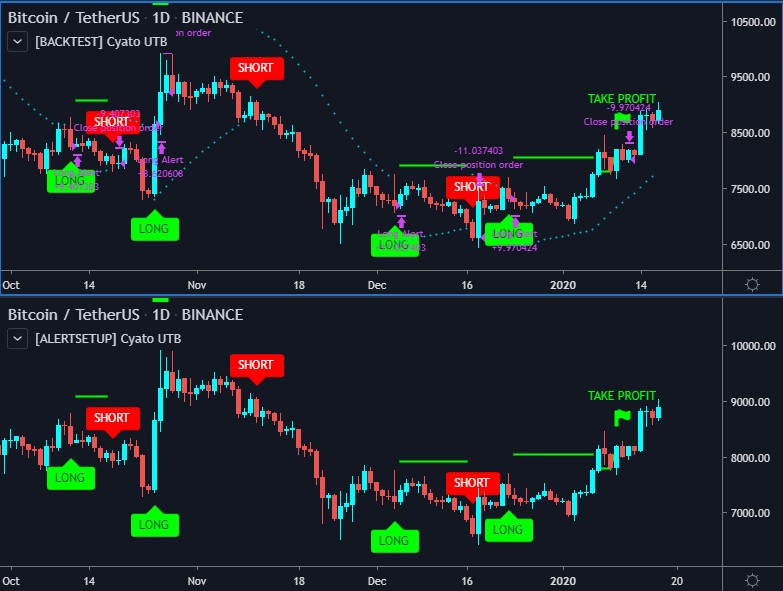
First, add the Ultimate Trading Bot indicator to the chart. Make sure you selected the Backtest version.
Configuring the indicator
The indicator allows you to create any kind of strategy. This said, here we only want buy and sell signals, since we will not be shorting (shorting as in margin trading).
Let's start with opening the indicator's parameters and disable everything. Turn everything off: the trend lines, the entry, the stop loss and take profit. You should now see zero trade on the chart.
Let's actually start with choosing the good entries. Depending on the time frame you wish to trade upon, select a Swing or Scalp entry.
- Low time frames (< 30 min): Scalp entries.
- High time frames (>= 30mni): Swing entries.
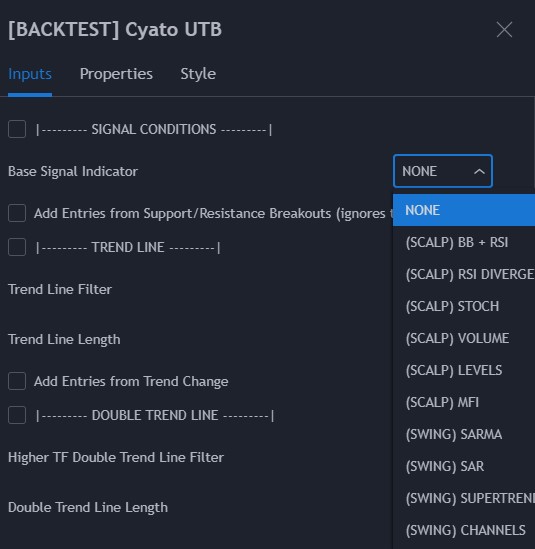
In this example, we will be choosing the SAR entry, and on a 1 Day timeframe on the Bitcoin / US Dollar chart from Binance.
By default, even after choosing the base entry, you will not see any trade. In fact if you zoom out, you will see a single long or short entry.
This is normal, the indicator will not reverse unless you tell him to. Go into the advanced parameters section, and click on Allow reverse orders.
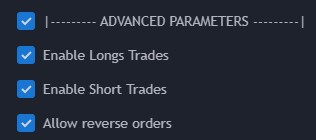
This is better! We now have long and short signals that can be used as buy and sell signals.
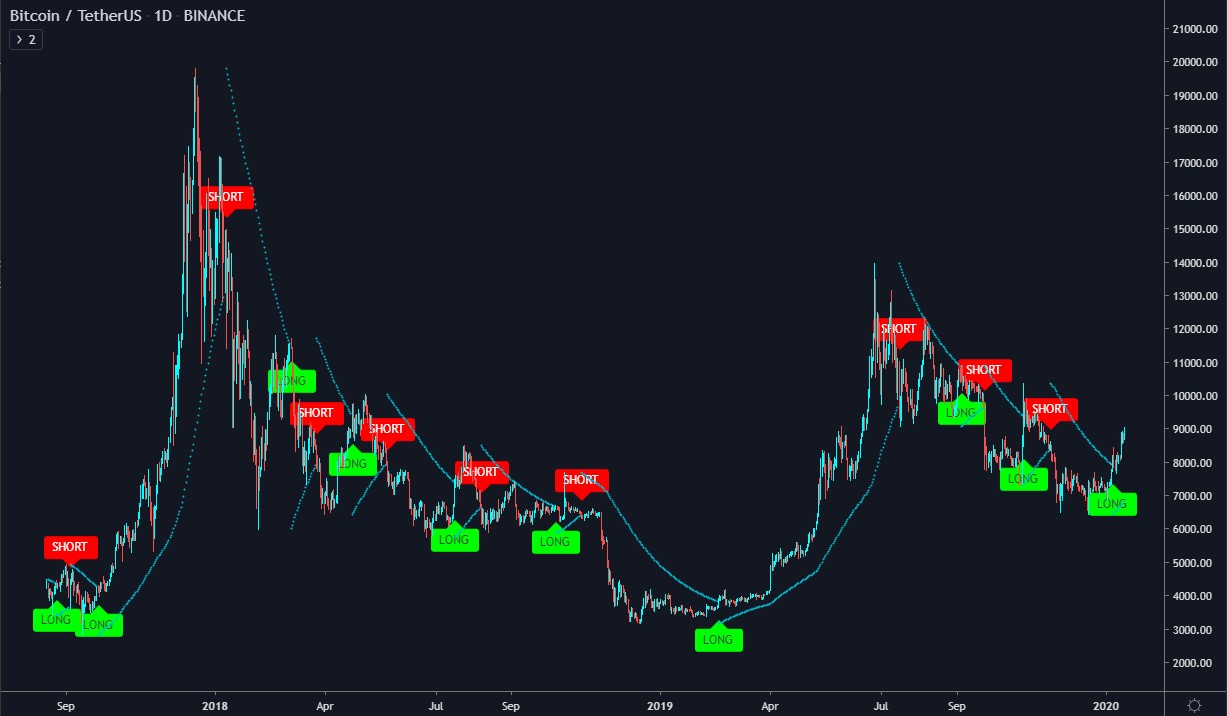
From this point, the entries look good, we can start backtesting.
Backtesting your strategy
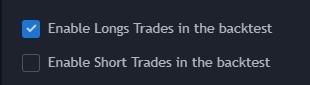
Since we are only interested in buying and selling, we must disable the short trades results from the backtest.
We are now ready to actually start backtesting. Open the Strategy Tester. We are going to look at the overview.
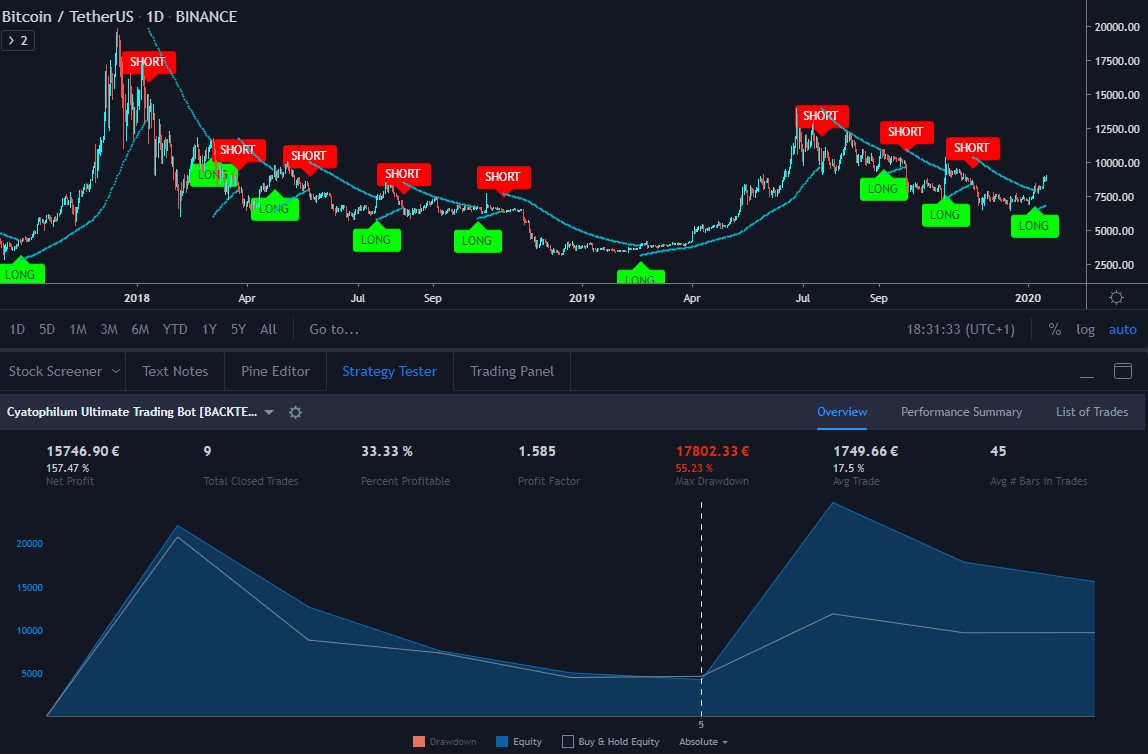
The blue shape is called the strategy equity. It shows how our inital capital behaves as the trades get piled-up. Meanwhile the white line is the so called Buy & Hold return we were talking about.
Note that the strategy tester takes compounding into account.
We can already tell we picked the right kind of entry since the end-result equity, also called Net Profit, is higher (150%) than the Buy & Hold (100%). So if we picked this strategy, we would already beat a holder...
However we want a much better strategy than that.
- 1. We want more trades!
- 2. We want more profit!
Yeah, right?
Almost every base indicator has a parameter allowing us to tweak the entries. Right click anywhere in the Strategy tester to open the properties. Since in this example we are using the PSAR entry, we will change the PSAR value a bit.

A quick testing shows that a value of 7 brings the best results. We are looking at increasing the Net Profit from the Strategy Tester. With this new config, we more than doubled the net Profit! Note that it also increased the number of trades, which is a good thing.
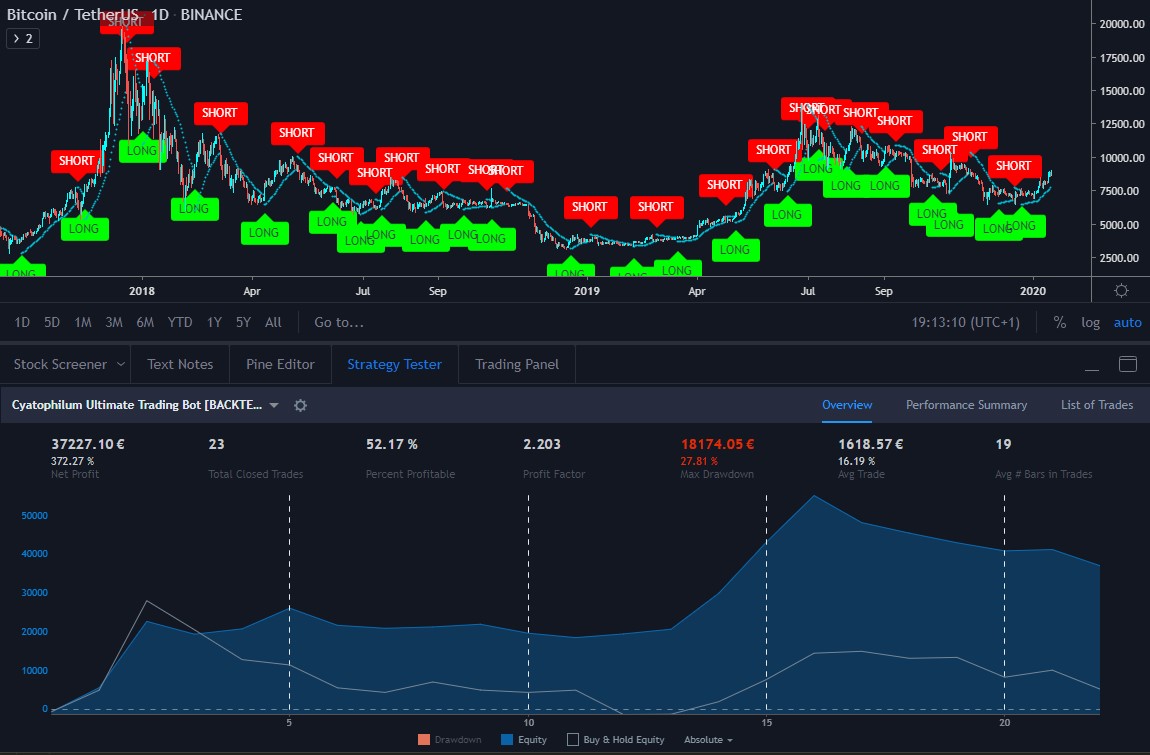
We could stop here... but we can do better.
The idea is to activate the Take Profit system, because with a good trailing we can get better exits (sell signals).
Here is what I found for this example: a 10% take profit with a 5% trailing deviation.
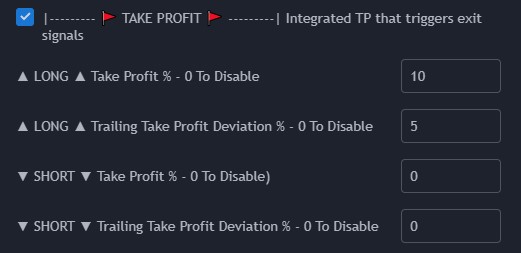
The Take Profit signals are drawn on chart with green flags. Our strategy will now sell on a flag or on a short signal!
And guess what, the Net Profit almost doubled again. That is thanks to the Trailing take profit!
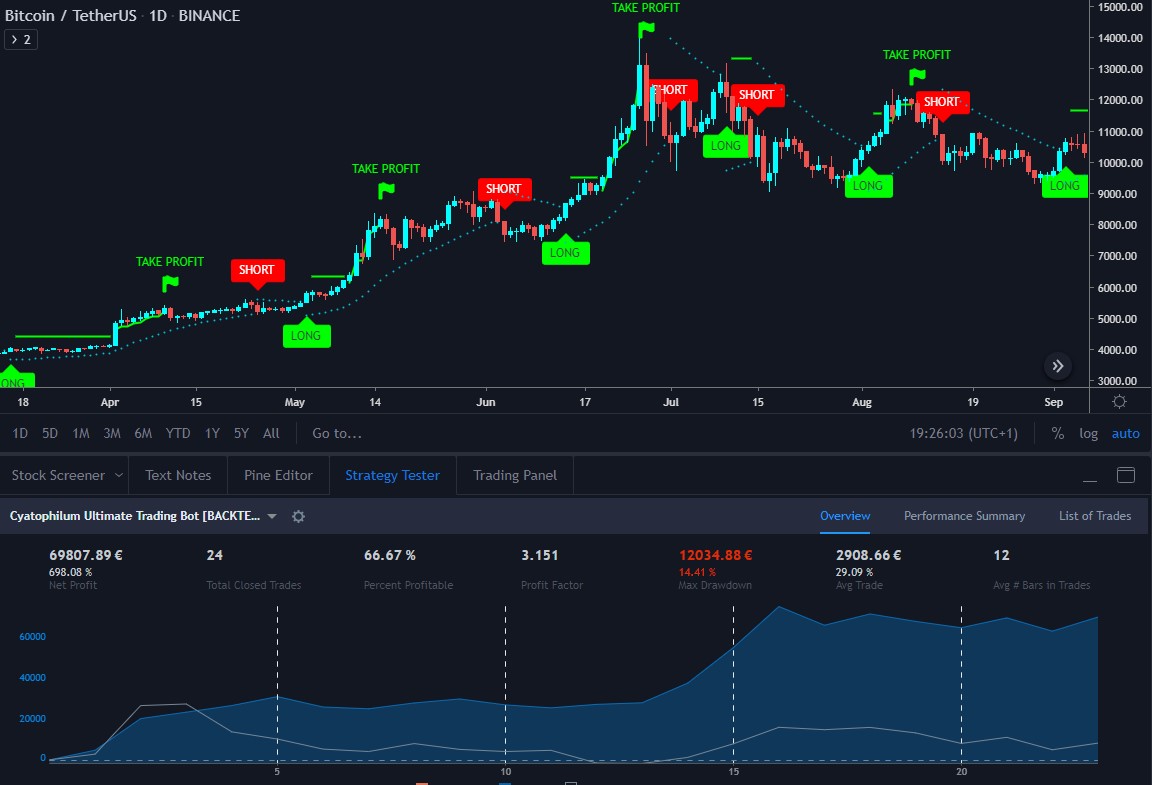
Once we are satisfied with our strategy, we can move on creating the alerts.
Note that for a strategy to be profitable, the Net Profit must be positive (greater than zero), otherwise we lose money. Another way to see if a strategy is profitable is to look at the Profit Factor which must be greater than 1.
Trading with the Strategy
Configuring the Alert Setup
To create the alerts, add the Alert Setup version of the indicator, then replicate the parameters. I recommand to keep the backtest version on the chart. Both versions must look exactly the same once you are done configuring.
Creating the alerts
If this is your first time creating alerts, please read this article and come back.
We will need 2 alerts for this kind of strategy.
- LONG ENTRY: This will be the buy alert. It will trigger when a green "Long" label shows up on chart.
- LONG EXIT WITH REVERSE: This will be the sell alert. It will trigger when a take profit green flag is hit or when a red "Short" label shows up on chart.
Remember to use "Once per bar close" when creating your alerts.
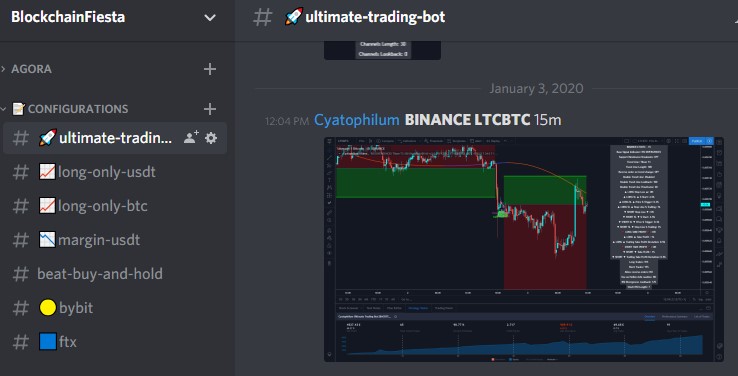
If you do not want to create your own strategies, you can simply pick one from the community. Join our Discord channel where I share the best configurations we can find!
Written by Cyatophilum - Created 4 years ago - Last edited today
Recent Articles
What if instead of buying a stock, crypto, currency on ...
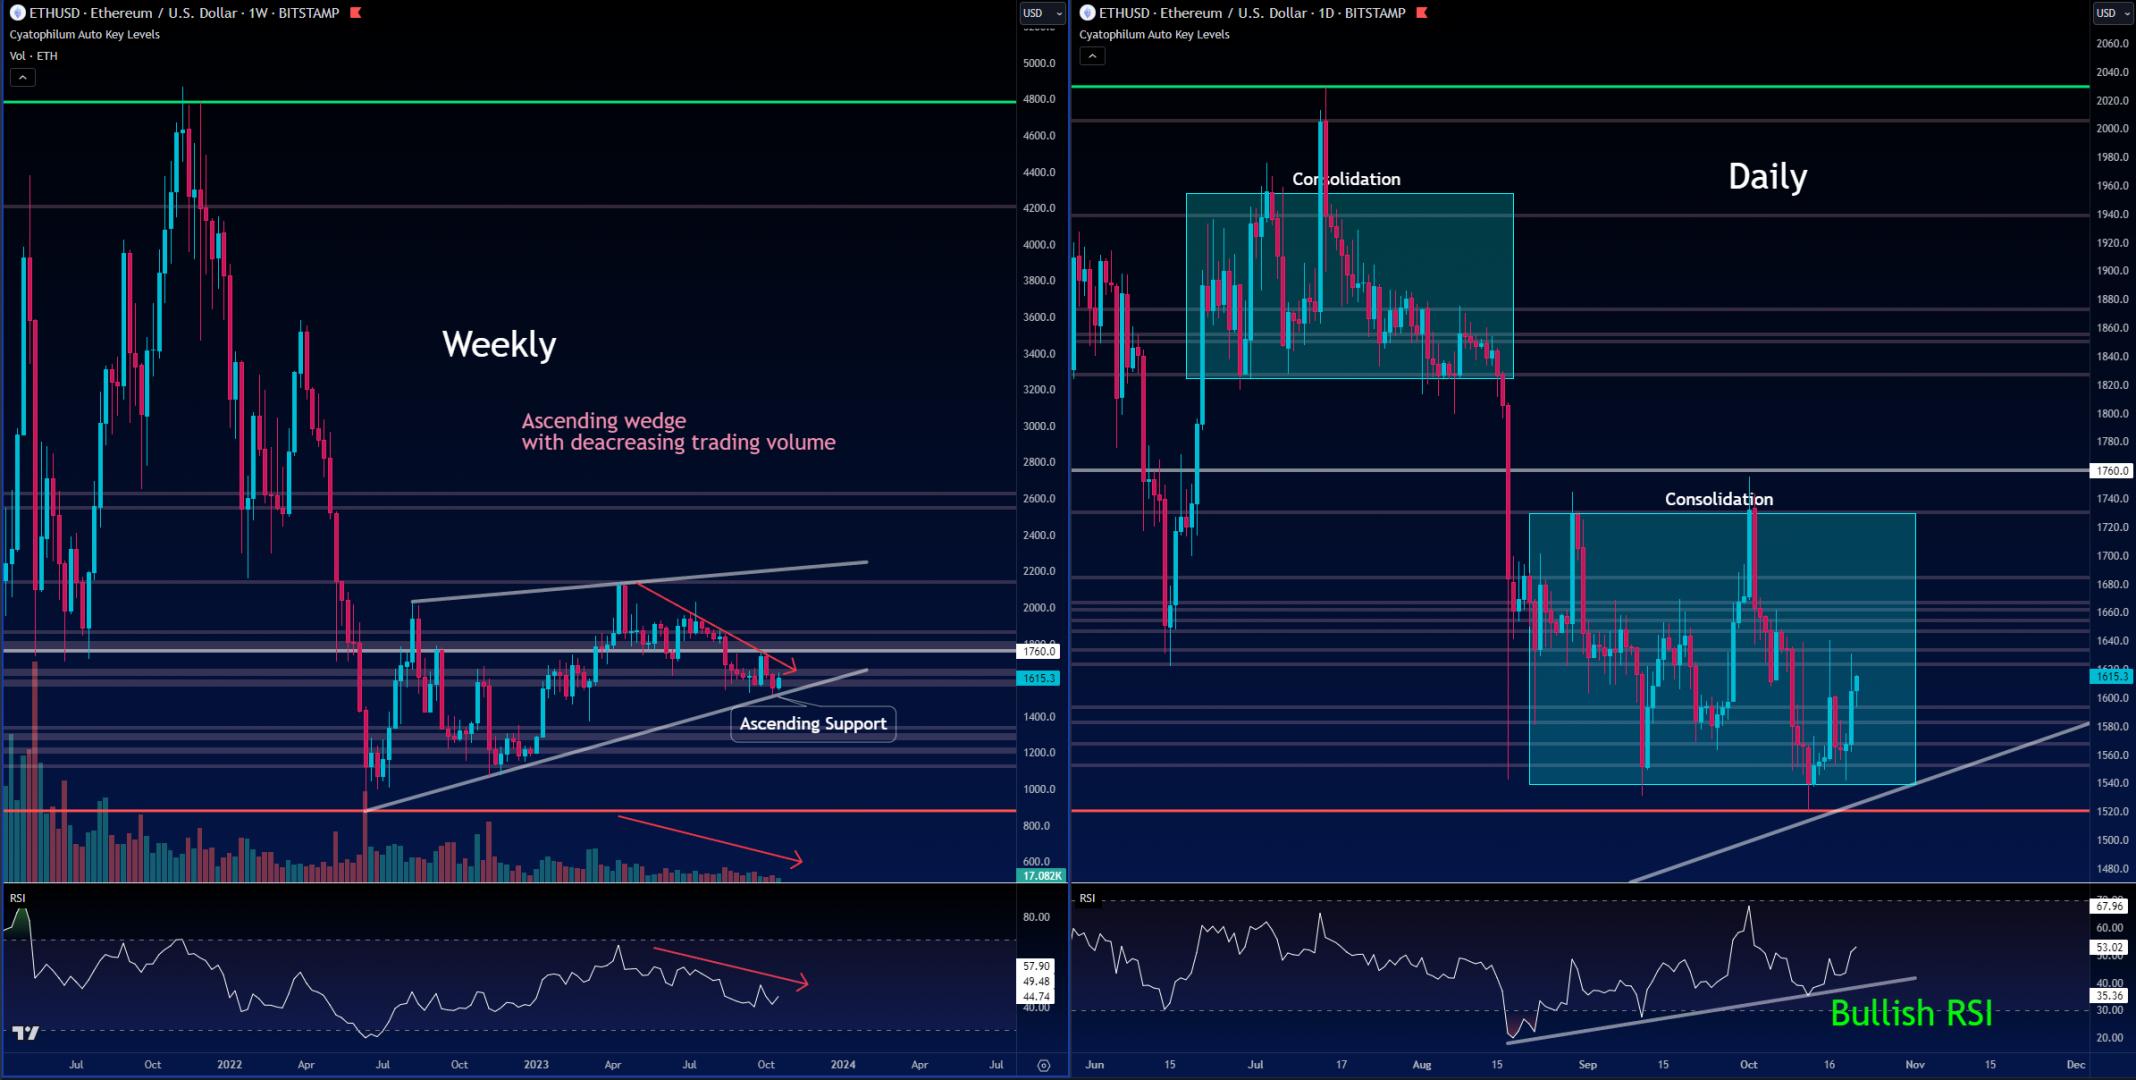
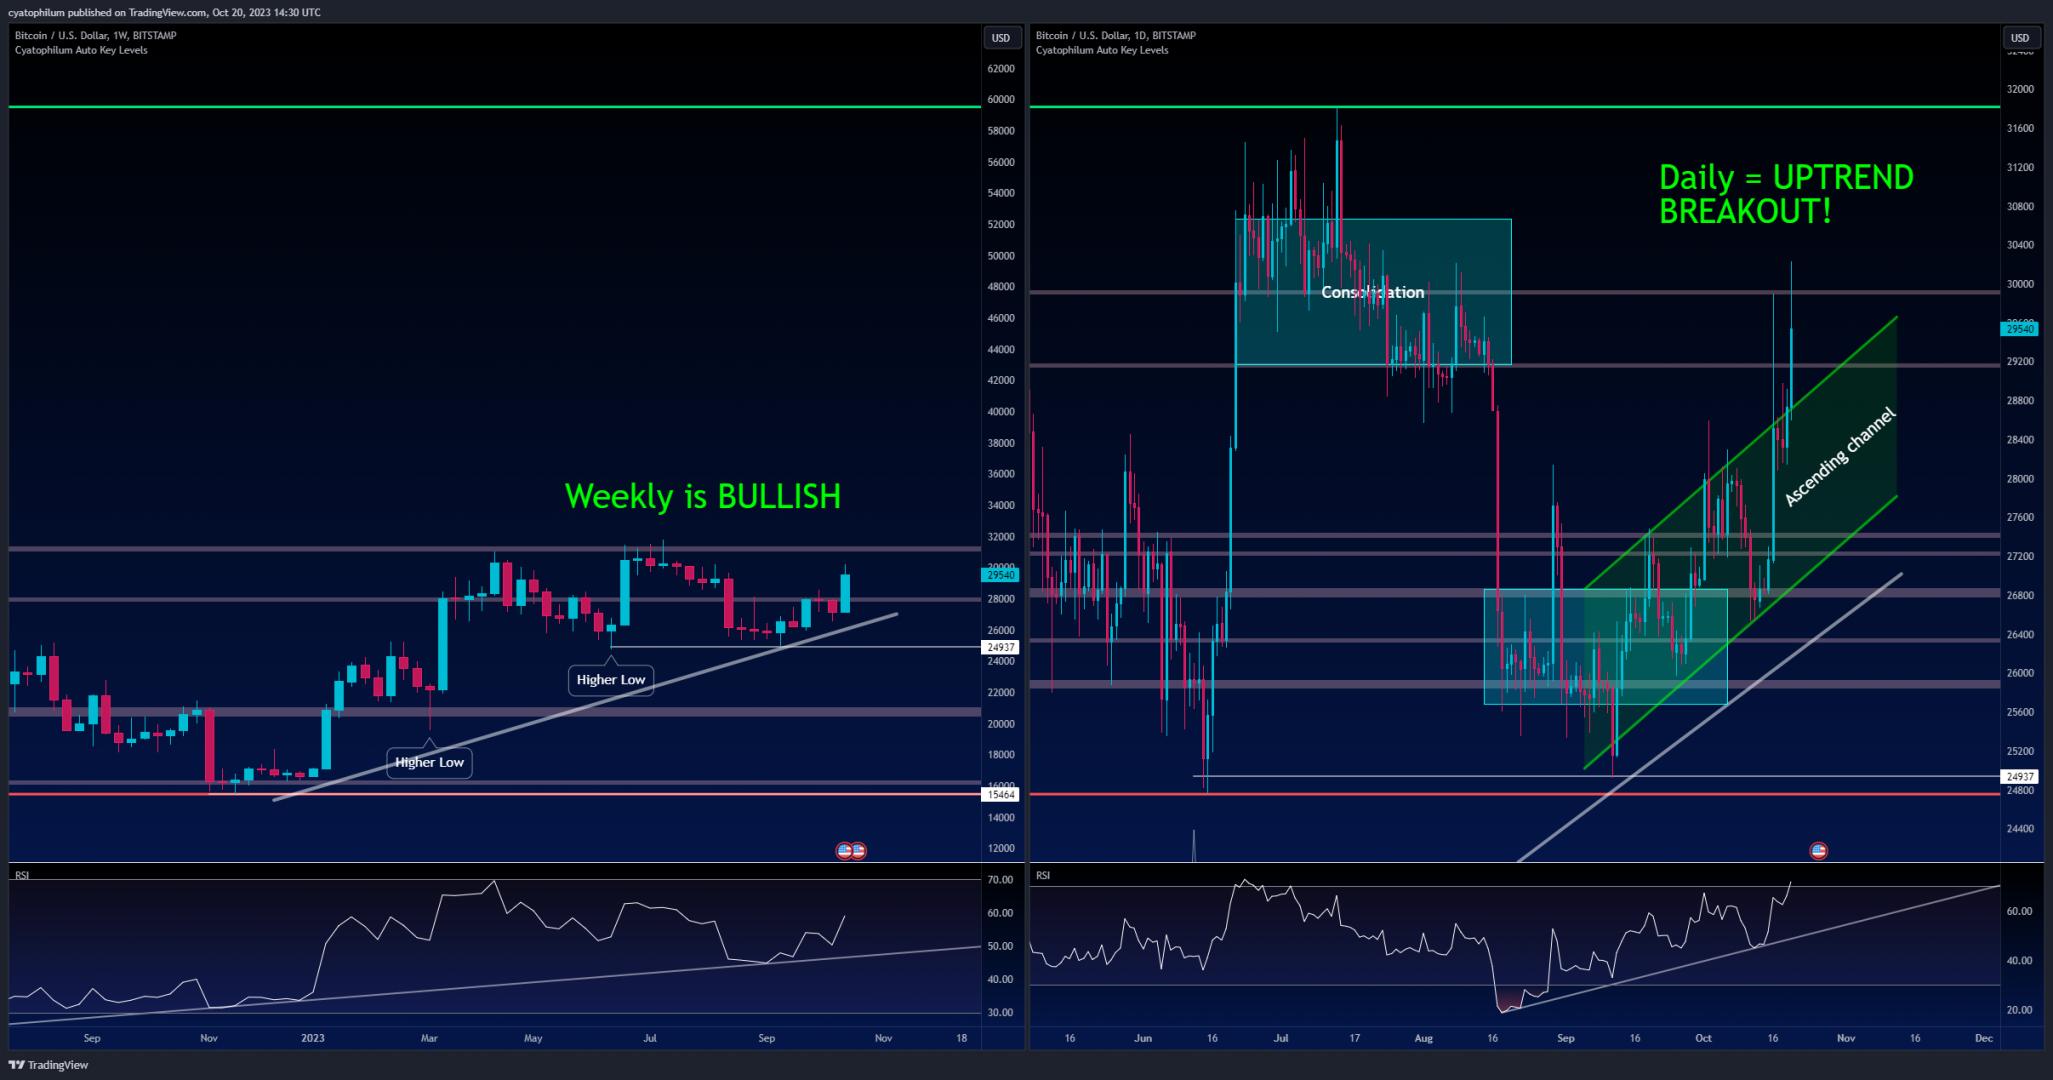
Let's start on the weekly and daily charts:The weekly shows an ascending wedge.A rising wedge is oft ...
Hi guys, I've been thinking of how to make useful ideas, and here's what I came up with.I will be wa ...
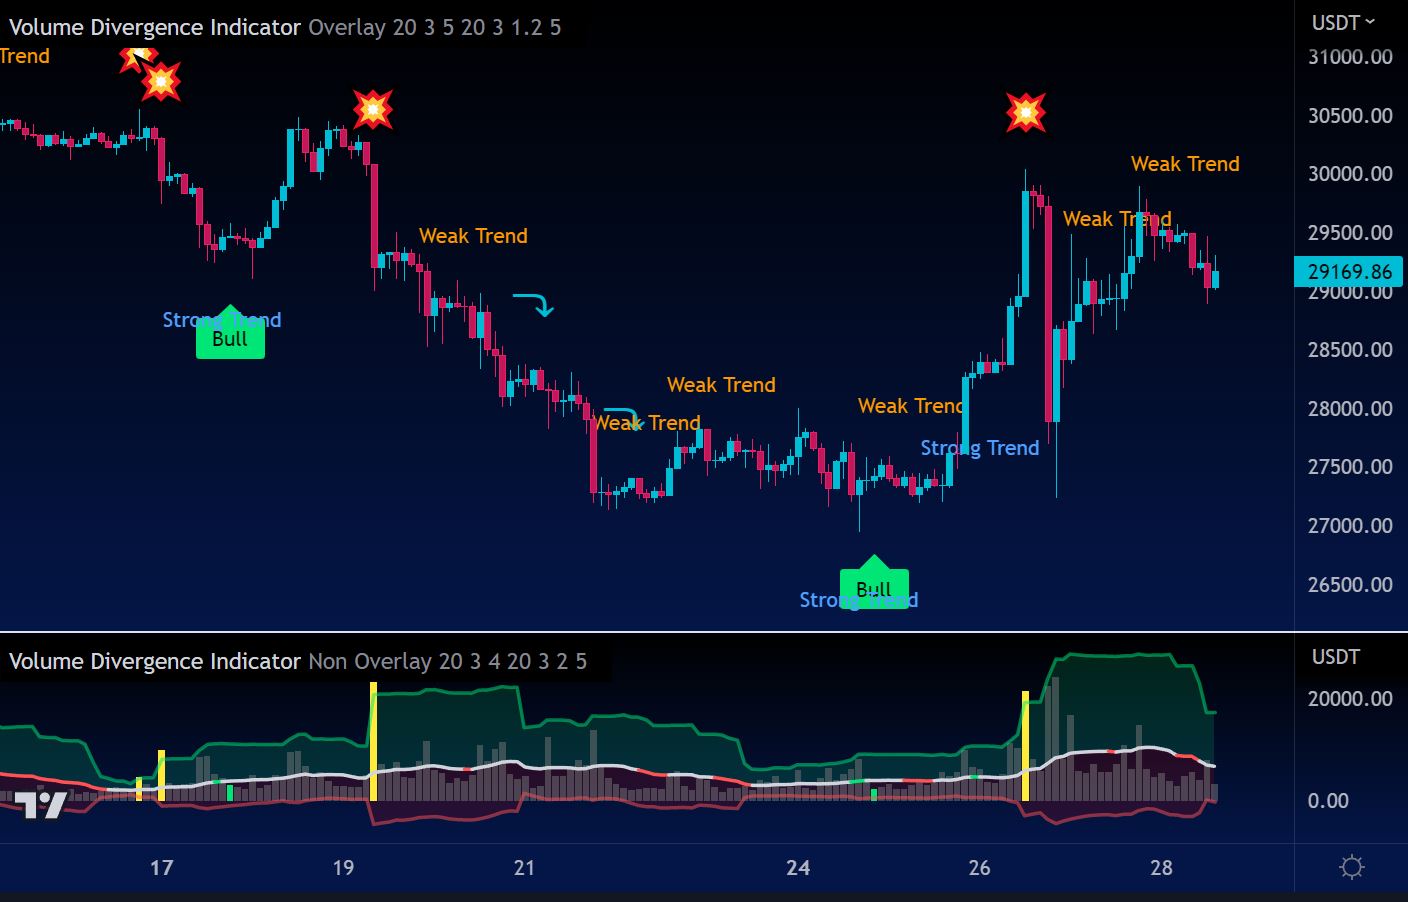
How to Use the Volume Divergence Indicator to Improve Your Trading StrategyAre you looki ...