
Monitor several pairs at once!
This indicator lets you get a quick glimpse at the market by choosing several pairs from TradingView.
How it works
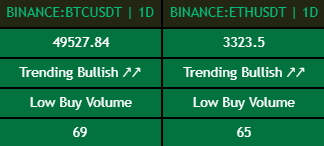
Real Time Information
Price
Pair trend direction and strength
Volume
All Time Highs or All Time Lows
If the pair is Overbought or Oversold
Indicators used
A 200 EMA is sent to each pair, used to find if the pair is either "Bearish" or "Bullish".
The indicator uses the Average Directional Index to tell if the pair is either "Trending" or "Going Sideways".
The indicator retrieves volume data for each pair, and tells if it is increasing ("Buy/Sell Volume") or decreasing ("Low Buy/Sell Volume") by looking at previous volume and price data.
"ALL TIME HIGH" or "ALL TIME LOW" will flash if the pair is making new highs/lows in the period of available data.
"Overbought" or "Oversold" will flash if the pair's RSI is above/below 30/70
How to use
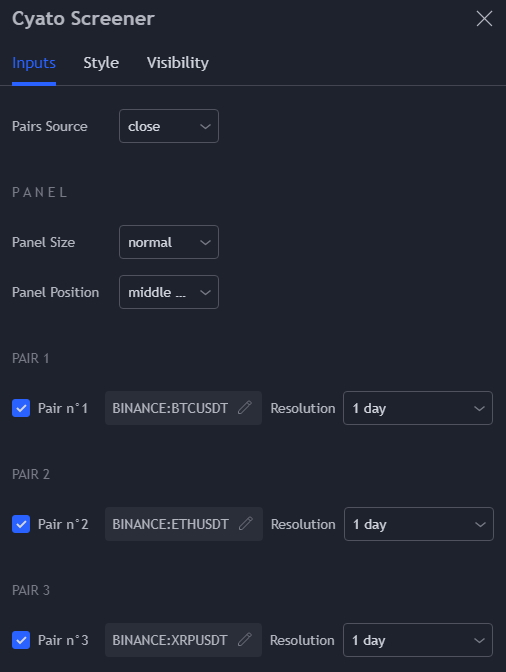
Choose which pairs to use
Each pair can be turned on/off, and has its own configurable timeframe.
Pro Tip: Monitor any number of pairs at once
The indicator can monitor up to 40 pairs, but it may be hard to fit them all on the screen. An easy solution is to add the indicator on the chart another time and move it to a new pane.
Graphics
The panel size can be configured in the settings.
The pairs color will change to green when the pair is bullish , and red when it is bearish
The panel can be positioned on 10 different places.
Private Discord Server: https://discord.gg/RVwBkpnQzm