BTCUSDT Short-term Analysis turns Bearish
Fundamentaly, the halving happened a few days ago, and as history shows the bull runs began way after the halving day. We could heard in French media that the price will be "halved". Maybe they were right !
No, of course, the real definition is the block rewards being divided by 2, which is a bad news for miners which are seeing their production price increase/ or rentability decrease, as you prefer. And this is a real issue with a potential impact on price. Bitcoin being close to ATH, miners would make sense to take their profit as the difficulty increase. We could also see a surge in Bitcoin transaction fees.
=> fundamentals remain good long term, short term not so much.
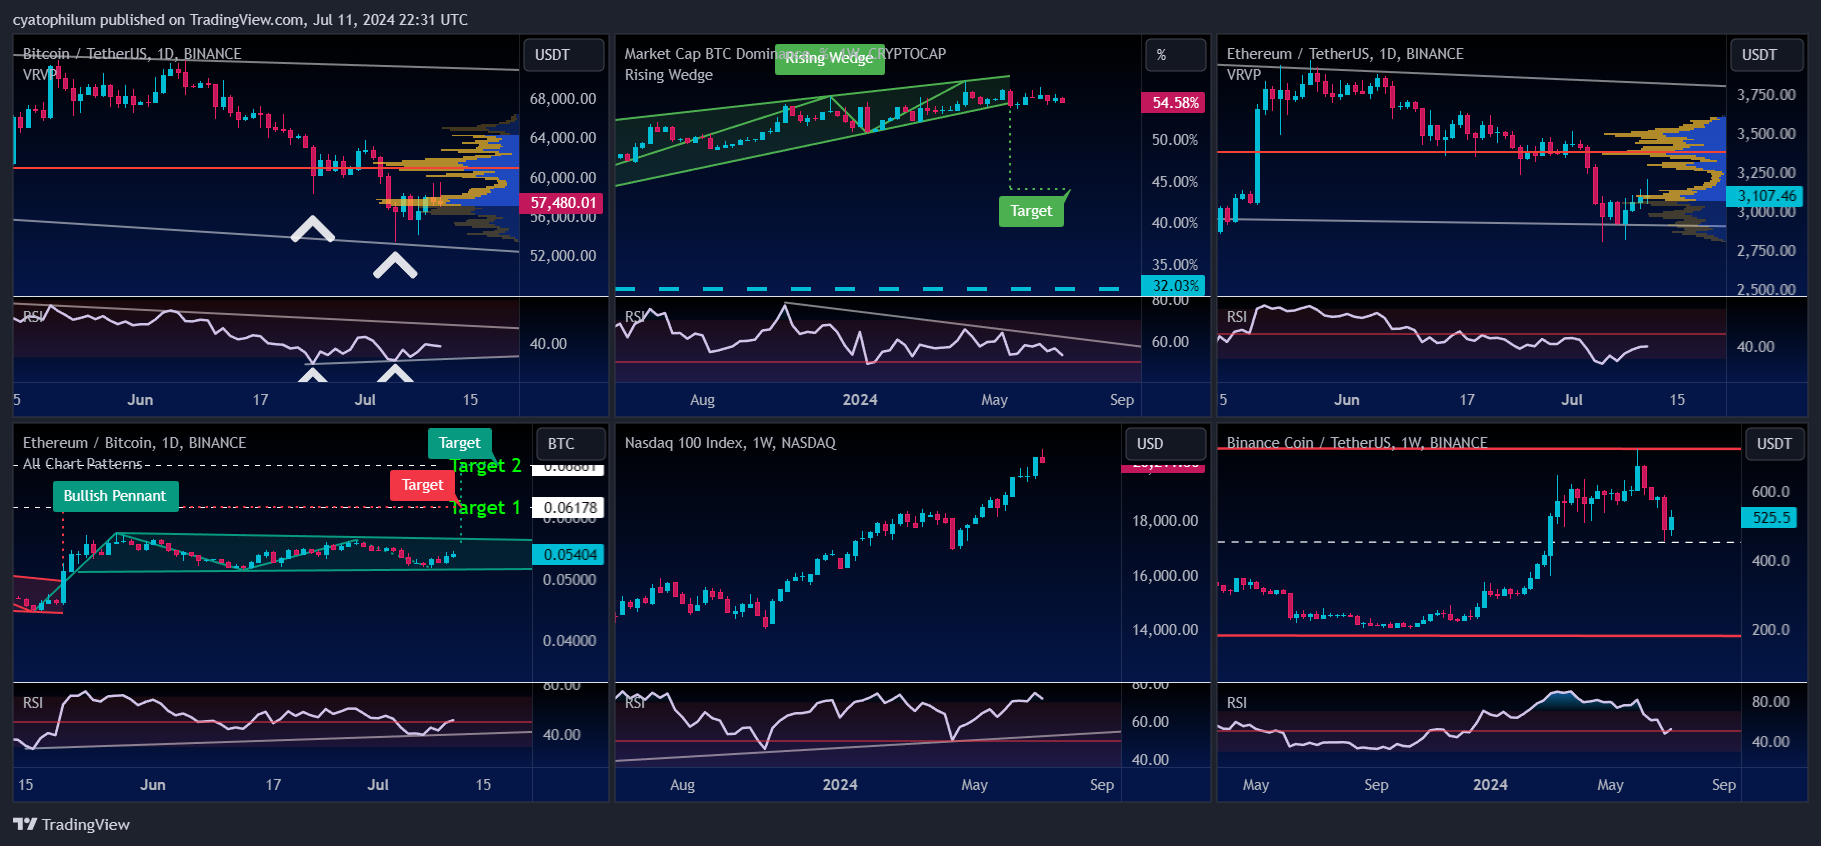
Back to pure price action, things are getting interesting.
Those red backgrounds means that the NASDAQ and BTC.D (dominance) are falling at the same time, which is in my opinion often happening at a top, or in a bear market. Indeed, the stock market is still very correlated to cryptos, and a reduction in Bitcoin dominance means less capitalisation in the Bitcoin and more into altcoins.
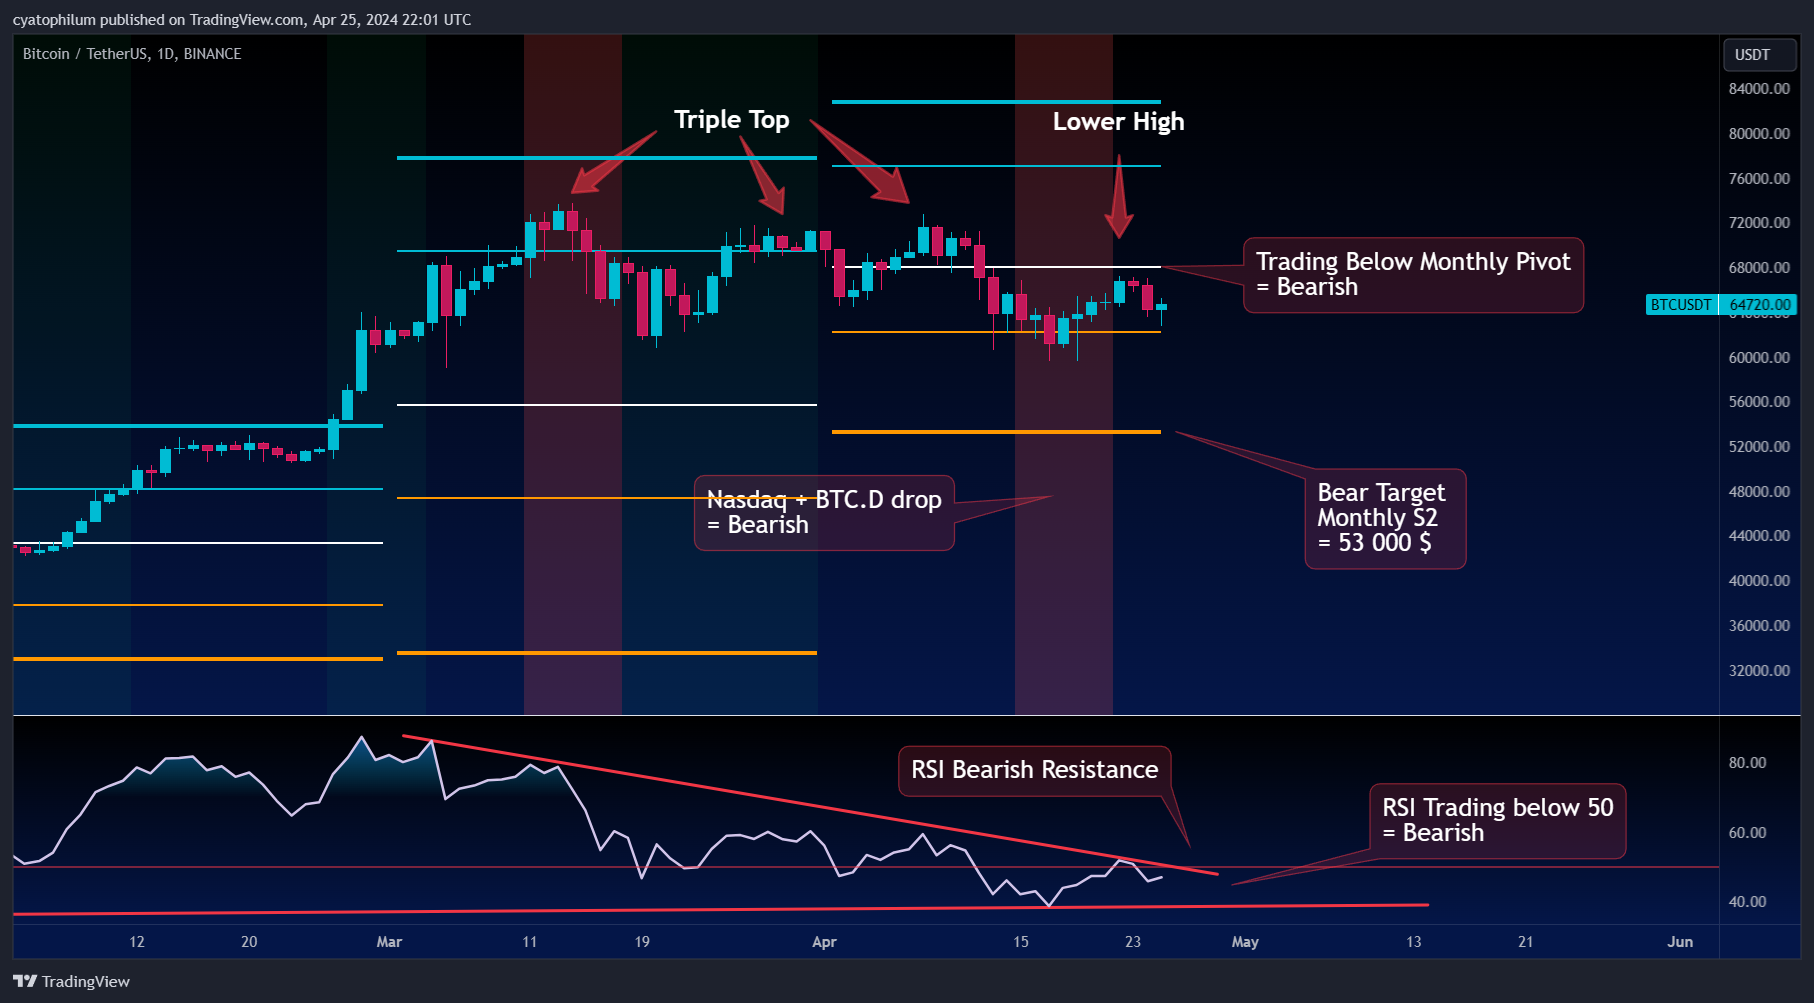
A few short-term bearish arguments:
- We can't deny a double/triple top and lower highs in recent prices.
- Price is trading below monthly pivot point, which often means for traders a bearish outcome.
- RSI is ranging below the 50 mark (bearish), and is consolidating: a huge move is preparing.
=> My target if I were to short Bitcoin on the daily timeframe would be 53 000$ which is the monthly S2 pivot. However I do not short Bitcoin since I am swing trading long only, so currently in USDT.
Update 03/05/24:
NADSAQ recovered most of its losses and wow, Bitcoin is up too!
This is rassuring for the bulls however I am looking at RSI and waiting for a break above its descending trendline and above 50 before considering a long entry.
Written by Cyatophilum - Created 2 years ago - Last edited 2 years ago
Recent Articles

Introducing the "Trend or Range?" Indicator
Understanding market conditions is a cornerstone of successful trading. Whether you’re trading cryptocurrencies, stocks, or forex, identifying if a market is trending or range-bound can drastically enhance your strategy’s effectiveness. The "Trend or Range?" indicator is here to simplify this process.
What Is the "Trend or Range?" I ...
We are thrilled to announce that short bots are now available!
In this article, we will see why a short bot could be interesting, how it works, and how to trade safely.
Why use a short bot?
Just like a buy and sell bot, the idea of a short bot is to make a profit out of price action, but in a bear market.
For a buy and sell bot, we just need a simple spot trading wallet, ...


Ethereum is now trading at $2600 and this month saw a lot of volatility but mainly bearish as the price went from above the $3000 level down to the exact 0.236 Fibonacci level at $2130.
The August monthly candle is printing a long lower shadow and the close above or below the 24 months EMA will be crucial to indicate a global trend. It will be 3 bearish candles in a row, which has been the maxi ...
Welcome to our weekly analysis of the cryptocurrency space.
BTC/USDT
The BTCUSDT chart shows Bitcoin trading within a descending channel, with recent price action bouncing off the lower boundary of this channel, indicating potential support around the $53,000 level. The RSI indicates bullish divergence, suggesting a possible trend reversal or a strong bounce from this support level ...