Ethereum Surges Above Key Resistance Level: Bulls in Control?
Ethereum (ETH) has recently seen a decent increase in price, breaking above the $1,750 resistance level and continuing to rally higher. The bulls successfully broke through the $1,860 resistance level, which has now become a support level for the altcoin. ETH has set a new multi-month high of $1,944, but some warning signals are being demonstrated by the RSI. However, the price is still clearing the $1,800 resistance level on the daily chart.
The overhead price ceiling for ETH is currently set at $1,930, but the ultimate goal for the bulls is to break the $2,000 mark. Nevertheless, analysts are warning that there may be heightened selling pressure within the next few weeks due to the over 1.1 million ETH being awarded to validators and available for immediate withdrawal after the Shanghai Upgrade (April 12).
Overall, ETH is currently in a bullish trend and traders should keep an eye on the support and resistance levels mentioned above, as well as any potential news or updates regarding the Shanghai Upgrade. Happy trading!
Written by Cyatophilum - Created 3 years ago - Last edited 3 years ago
Recent Articles

Introducing the "Trend or Range?" Indicator
Understanding market conditions is a cornerstone of successful trading. Whether you’re trading cryptocurrencies, stocks, or forex, identifying if a market is trending or range-bound can drastically enhance your strategy’s effectiveness. The "Trend or Range?" indicator is here to simplify this process.
What Is the "Trend or Range?" I ...
We are thrilled to announce that short bots are now available!
In this article, we will see why a short bot could be interesting, how it works, and how to trade safely.
Why use a short bot?
Just like a buy and sell bot, the idea of a short bot is to make a profit out of price action, but in a bear market.
For a buy and sell bot, we just need a simple spot trading wallet, ...


Ethereum is now trading at $2600 and this month saw a lot of volatility but mainly bearish as the price went from above the $3000 level down to the exact 0.236 Fibonacci level at $2130.
The August monthly candle is printing a long lower shadow and the close above or below the 24 months EMA will be crucial to indicate a global trend. It will be 3 bearish candles in a row, which has been the maxi ...
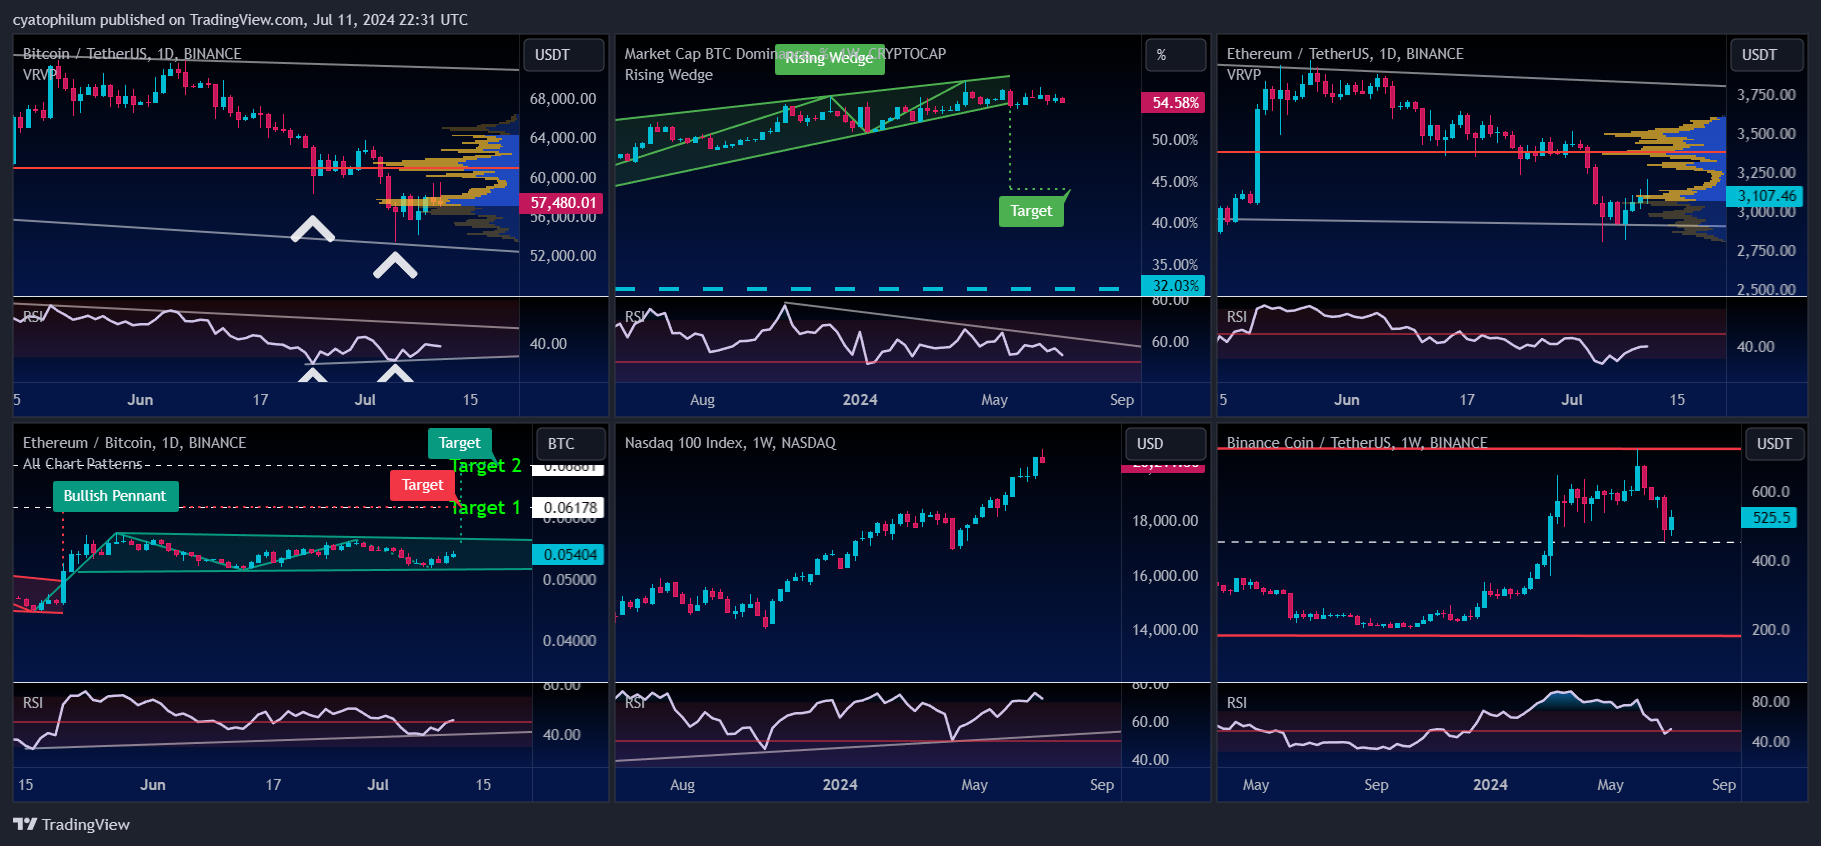
Welcome to our weekly analysis of the cryptocurrency space.
BTC/USDT
The BTCUSDT chart shows Bitcoin trading within a descending channel, with recent price action bouncing off the lower boundary of this channel, indicating potential support around the $53,000 level. The RSI indicates bullish divergence, suggesting a possible trend reversal or a strong bounce from this support level ...