How to Use the Volume Divergence Indicator to Improve Your Trading Strategy
How to Use the Volume Divergence Indicator to Improve Your Trading Strategy
Are you looking for a way to improve your trading strategy? Look no further than the Volume Divergence Indicator, a powerful tool that can help you identify potential trading opportunities based on price and volume patterns.
What is the Volume Divergence Indicator?
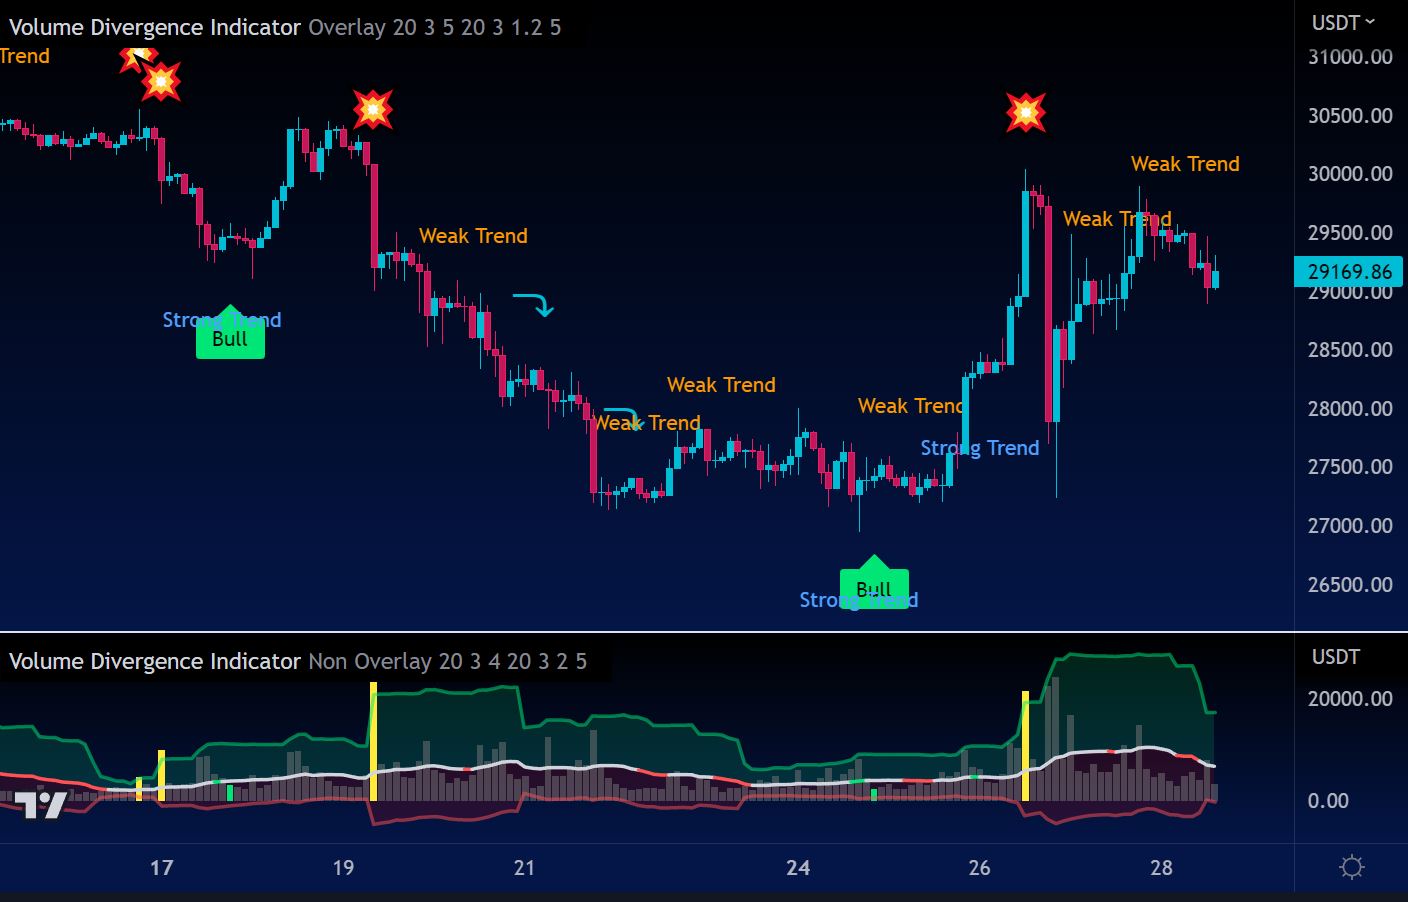
The Volume Divergence Indicator is a PineScript code that generates alerts when it detects patterns in the price and volume data of a security. Specifically, it can identify four types of patterns: bullish divergence, bearish divergence, volume spikes, and volume contractions. In addition, it can identify trends in the volume data, which can help you adjust your trading strategy accordingly.
How to Use the Volume Divergence Indicator
Using the Volume Divergence Indicator is easy. Simply add the code to your trading platform, and adjust the inputs to your liking. There are four input categories:
- Overlay mode: choose between overlay and non-overlay mode
- Divergences Signals: adjust the sensitivity of the bullish and bearish divergences
- Volume Spike & Contraction Signals: adjust the sensitivity of the volume spikes and contractions
- Volume Trend: adjust the sensitivity of the volume trend
Once you have set your inputs, the Volume Divergence Indicator will generate alerts when it detects patterns in the price and volume data of the security you are trading.
Types of Alerts Generated by the Volume Divergence Indicator
The Volume Divergence Indicator generates alerts based on four types of patterns:
- Bullish divergence: generates an alert when prices are making lower lows but volume is making higher lows. This would suggest that the selling pressure is weakening, and a bullish reversal may be imminent.
- Bearish divergence: generates an alert when prices are making higher highs but volume is making lower highs. This would suggest that the buying pressure is weakening, and a bearish reversal may be imminent.
- Volume spike: generates an alert when volume spikes above a certain threshold, such as two standard deviations above the moving average. This would suggest that there is unusual buying or selling activity in the market, and traders may want to pay attention to the price movements that follow.
- Volume contraction: generates an alert when volume contracts to a certain level, such as two standard deviations below the moving average. This would suggest that there is little buying or selling activity in the market, and traders may want to be cautious until volume picks up again.
In addition, the Volume Divergence Indicator can identify trends in the volume data, which can help you adjust your trading strategy accordingly. If the volume is trending above the moving average for a certain number of periods, such as five or ten, it may suggest that there is a sustained increase in buying pressure, and traders may interpret this as a bullish signal for the stock. Conversely, if there is a sustained increase in selling volume, it may suggest that there is a sustained increase in selling pressure, and traders may interpret this as a bearish signal for the stock.
However, it's important to note that volume alone should not be the sole factor for making trading decisions. Other technical indicators, fundamental analysis, and market conditions should also be considered. Additionally, high volume can sometimes be the result of speculative or manipulative trading, so it's important to do thorough research and analysis before making any trading decisions.
Where to get the indicator ?
The indicator is open source on TradingView. Here is the link: https://www.tradingview.com/script/nxR6JqcL-Volume-Divergence-Indicator/. Enjoy!
Written by Cyatophilum - Created 3 years ago - Last edited 3 years ago
Recent Articles

Introducing the "Trend or Range?" Indicator
Understanding market conditions is a cornerstone of successful trading. Whether you’re trading cryptocurrencies, stocks, or forex, identifying if a market is trending or range-bound can drastically enhance your strategy’s effectiveness. The "Trend or Range?" indicator is here to simplify this process.
What Is the "Trend or Range?" I ...
We are thrilled to announce that short bots are now available!
In this article, we will see why a short bot could be interesting, how it works, and how to trade safely.
Why use a short bot?
Just like a buy and sell bot, the idea of a short bot is to make a profit out of price action, but in a bear market.
For a buy and sell bot, we just need a simple spot trading wallet, ...


Ethereum is now trading at $2600 and this month saw a lot of volatility but mainly bearish as the price went from above the $3000 level down to the exact 0.236 Fibonacci level at $2130.
The August monthly candle is printing a long lower shadow and the close above or below the 24 months EMA will be crucial to indicate a global trend. It will be 3 bearish candles in a row, which has been the maxi ...
Welcome to our weekly analysis of the cryptocurrency space.
BTC/USDT
The BTCUSDT chart shows Bitcoin trading within a descending channel, with recent price action bouncing off the lower boundary of this channel, indicating potential support around the $53,000 level. The RSI indicates bullish divergence, suggesting a possible trend reversal or a strong bounce from this support level ...