Indicator Tutorial - Cyatophilum Bands
Welcome to the getting started page dedicated to my automated trading strategy Cyatophilum Bands, which is in continuous development.

The strategy principle is to identify consolidation areas, catch breakouts and ride the trend as long as possible.
Trade examples
Breakout from Tight Consolidation
Price consolidates within a narrow range and identifies the breakout point.
False Breakout Avoidance
Filter out noise from the market by incorporating volume, trend and range filters.
Multi-Timeframe Analysis
Set the Bands time frame higher than the current chart to perform MTF analysis.
Reversal Confirmation
In the strategy direction settings, you can choose to go long, short or both.
Profitable Trend Continuation
A cool feature the take profit has is that it gets disabled when the trend is strong and clear, allowing to play safe in a ranging market, while maximizing profits in strong trends.
Indicator settings
Bands Settings
The band configuration settings allow you to create any kind of band, my favorite is the Donchian channels, but you can also create Bollinger and Kelter kinds of bands.
Filter Settings
The entry is triggered by a band breakout, but only that is not enough to create a solid strategy. Adjust the consolidation area, set a volume, range and trend filter to strengthen your entry.
Stop Loss Settings
Easily create a stop loss system using %, ATR, pips or AUTO calculation modes.
Add a trailing stop using ATR or Classic modes. (more modes can be added upon request)
Take Profit Settings
Set a take profit system using also different modes and the amazing feature to disable take profit during strong trends.
Backtest Settings
Backtest quickly using the information panel. See if you beat buy and hold and ATH buy and hold, as well as other stats like daily return.
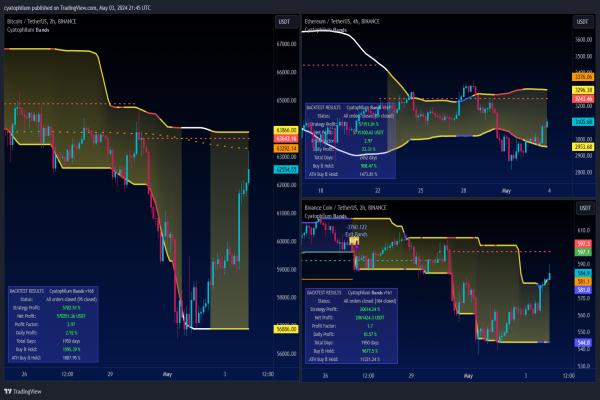
Backtesting results & preconfigured charts
BTC/USDT
Snapshot:
Chart : www.tradingview.com/chart/FgaRviaB/ (Access Required)
ETH/USDT
Snapshot:
Chart : www.tradingview.com/chart/5oUsAKH6/ (Access Required)
BNB/USDT
Snapshot:
Chart: www.tradingview.com/chart/jBbdKsmm/ (Access Required)
SOL/USDT
Snapshot:
Chart: www.tradingview.com/chart/LezV9owe/ (Access Required)
ADA/USDT
Snapshot:
Chart: www.tradingview.com/chart/01ITO4WL/
AVAX/USDT
Snapshot:
Chart: www.tradingview.com/chart/Zr3P1PFN/
LINK/USDT
Snapshot:
Chart: www.tradingview.com/chart/V60OFoGV/
MATIC/USDT
Snapshot:
Chart: www.tradingview.com/chart/LIRcJePq/
IMX/USDT
Chart: www.tradingview.com/chart/4Je2Gcka/
TRX/USDT
Snapshot:
Chart: www.tradingview.com/chart/nymtwE3u/
TRX is the kind of chart that takes advantage of the MTF band feature. The price being very volatile and noisy, setting a Band time frame to 1 day while trading on the 4H chart smooths it out a bit.
FIL/USDT (Filecoin)
Preconfigured Chart: www.tradingview.com/chart/hFwiCL4K/
VET/USDT
Chart: www.tradingview.com/chart/EB8WFt3D/
BTC/USDT 2H
Chart: www.tradingview.com/chart/HFrb8L7s/
Gaming Coins charts:
FLOKI/USDT
www.tradingview.com/chart/x5hVjGNX/
IMX/USDT
www.tradingview.com/chart/pITCLuzO/
GALA/USDT
www.tradingview.com/chart/jisfLbUw/
POND/USDT
Chart: www.tradingview.com/chart/iEDC3O8c/
ADA/USDT 4 hours Chart:
https://www.tradingview.com/chart/5e1mokuY/
SCRIPT ACCESS
Indicator and automation tools access can be purchased on my website.
Written by Cyatophilum - Created 2 years ago - Last edited 2 years ago
Recent Articles

Introducing the "Trend or Range?" Indicator
Understanding market conditions is a cornerstone of successful trading. Whether you’re trading cryptocurrencies, stocks, or forex, identifying if a market is trending or range-bound can drastically enhance your strategy’s effectiveness. The "Trend or Range?" indicator is here to simplify this process.
What Is the "Trend or Range?" I ...
We are thrilled to announce that short bots are now available!
In this article, we will see why a short bot could be interesting, how it works, and how to trade safely.
Why use a short bot?
Just like a buy and sell bot, the idea of a short bot is to make a profit out of price action, but in a bear market.
For a buy and sell bot, we just need a simple spot trading wallet, ...


Ethereum is now trading at $2600 and this month saw a lot of volatility but mainly bearish as the price went from above the $3000 level down to the exact 0.236 Fibonacci level at $2130.
The August monthly candle is printing a long lower shadow and the close above or below the 24 months EMA will be crucial to indicate a global trend. It will be 3 bearish candles in a row, which has been the maxi ...
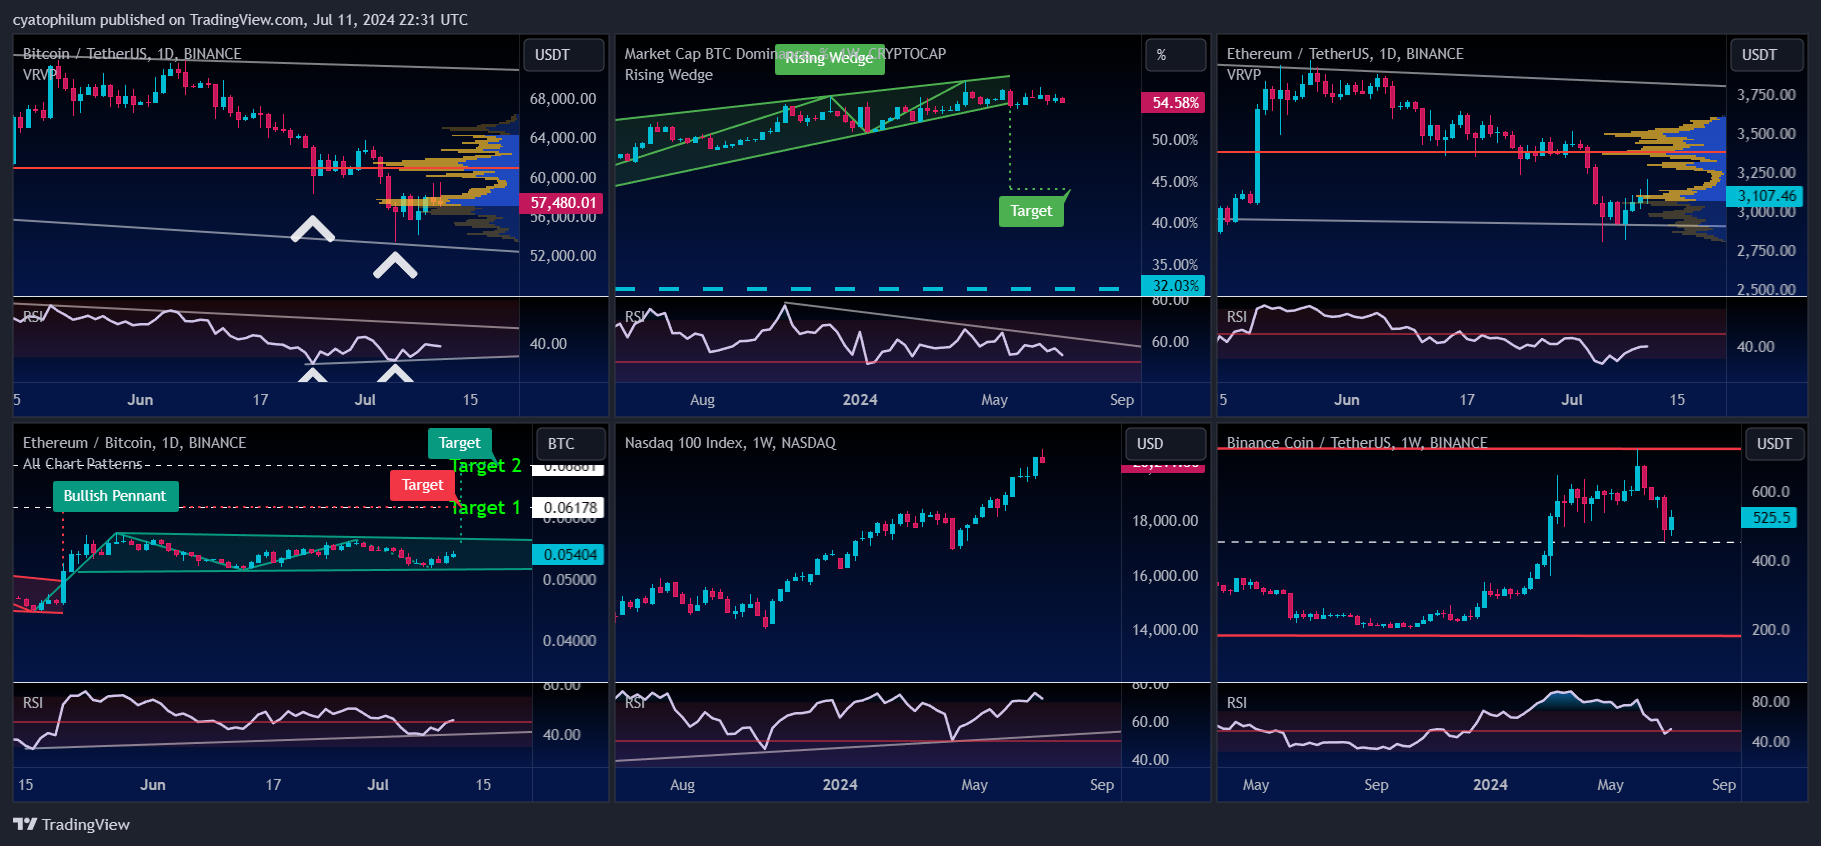
Welcome to our weekly analysis of the cryptocurrency space.
BTC/USDT
The BTCUSDT chart shows Bitcoin trading within a descending channel, with recent price action bouncing off the lower boundary of this channel, indicating potential support around the $53,000 level. The RSI indicates bullish divergence, suggesting a possible trend reversal or a strong bounce from this support level ...