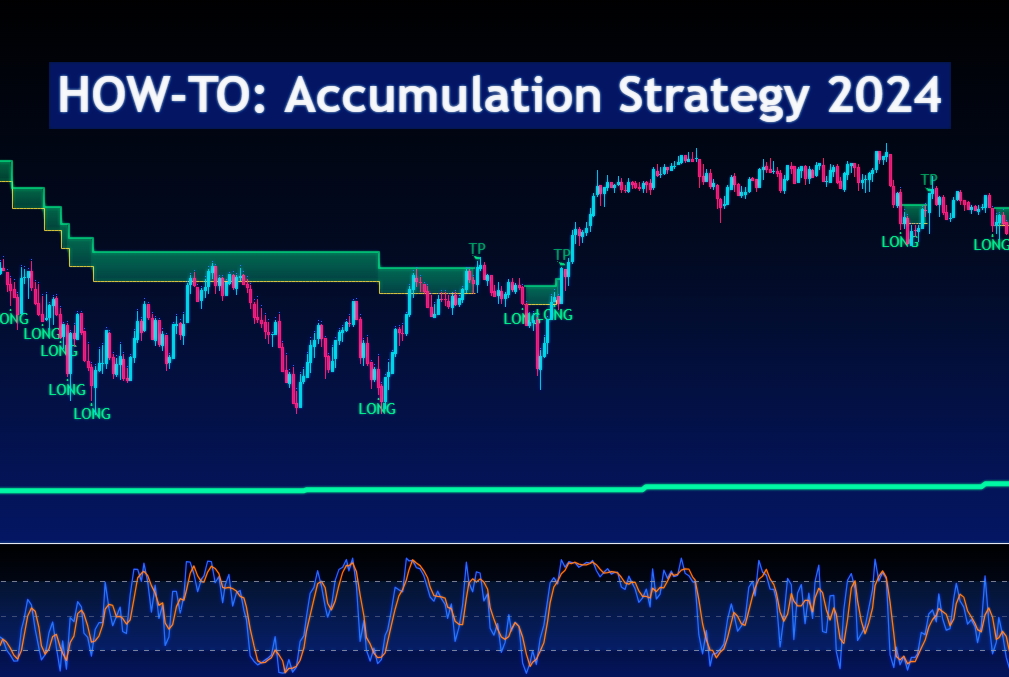
Simple Example
The strategy comes with several features, and the easiest way to explain them is through examples.
The Max Active Deals input allows to limit how many times the strategy can trigger a buy in a trade, just like the pyramiding setting. It can go up to 100.
In this example, the strategy has 10 max active deals. and is using the RSI feature to buy when RSI crosses below a configurable threshold, here 25.
Note: to get stronger signals, the RSI time frame has been set to 1 hour, since the chart is in a 30 min time frame.
In this trade, the strategy bought 8 times (yellow arrows) before selling at take profit, but it could have bought twice more.
Take Profit Feature
Customisable in the input tab, this feature allows you to set one or multiple take profit(s). You can set the value in either %, pips, or Auto mode.
To create multiple targets, increase the Number of take profit and set the Step between each TP.
In our previous example, instead of just one, I set 3 TPs with 1% value and a step of 1. The strategy will sell progressively at a quantity split even at each take profit, until the last TP is hit.
Note: Using multiple take profit is often used to improve risk management in trading.
Built-in Entry Options
The strategy comes with several built-in indicators, such as the RSI that we’ve seen, but here’s the list:
MTF RSI cross, RSI divergences
MTF Stochastic cross
MTF Bollinger Bands cross
Top & Bottoms
Double Top & bottoms
Higher/Lower Lows/Highs
Custom External Entries
If you want to use ANY external indicator from the TradingView library and use it as an entry signal, you can!
For example, let’s use the Squeeze Momentum Indicator by Lazybear. After adding it to the chart, we select the first plot which is the histogram. Then we select the condition “crossover” and “0”. It will create a buy when the histogram turns green.
Trend Filters
In trading, we try to avoid going against the global trend.
The strategy comes with several built-in trendlines, MTF, or you can use ANY external trendline from the TV library.
The strategy offers other built-in filters such as volume, overbought in range/trending market, or flat market entry filters.
Stop Loss
The stop loss can be turned on/off. You can set the value in either %, pips, ATR or Auto mode.
Note: When to use a Stop Loss? Using a stop kind of defeats the purpose of the strategy, but it can be useful if you plan to trade highly volatile and risky coins (remember LUNA ?) That is why the option is there.
How to use the strategy ?
The indicator access is unlocked by subscribing on my website.
Setting up a strategy
You can set up a strategy on your own chart in just one click using the preconfigured charts I will share below, or you can simply add the indicator yourself and play with the settings.
Backtesting
Backtesting is automatically done in the Strategy Tester Tab.
Creating Alerts
Once you have your strategy setup on the chart:
1 - Set the alert message in the indicator inputs (scroll to the bottom, you will find an “alert’ section)
2 - Save your chart and do not touch it anymore unless you want to update your alert (optional but recommended)
3 - Create an alert on Cyatophilum Accumulation Strategy, using the option “alert() function calls only” (this is really important!)
Only one alert is needed to handle all the strategy events! (entry, take profit, stop loss, etc.) Even a free TradingView user can create a strategy!
Automation
The subscription that I offer also comes with Automation bots using the Binance spot trading API.
Important: if you wish to automate your strategies, make sure your TradingView account has access to alert webhook notifications.
That’s it for this tutorial!
Pretty easy right? No, I know it can get complicated at first. 😣
That is why I make preconfigured charts. To use them, click on the chart links, then click “copy”, then “save” your “layout” to get your own chart that you can use and edit. Enjoy!
Preconfigured charts
BTC/USDT
Chart: https://www.tradingview.com/chart/9amYIHMF/
ETH/USDT
Chart: https://www.tradingview.com/chart/4YZ8sNAs/
BNB/USDT
Chart: https://www.tradingview.com/chart/sM4WcNl4/
MATIC/USDT
Chart: https://www.tradingview.com/chart/9oVKK2kw/
EGLD/USDT
Chart: https://www.tradingview.com/chart/m3HIKBcR/
Written by Cyatophilum - Created 2 years ago - Last edited 2 years ago
Recent Articles

Introducing the "Trend or Range?" Indicator
Understanding market conditions is a cornerstone of successful trading. Whether you’re trading cryptocurrencies, stocks, or forex, identifying if a market is trending or range-bound can drastically enhance your strategy’s effectiveness. The "Trend or Range?" indicator is here to simplify this process.
What Is the "Trend or Range?" I ...
We are thrilled to announce that short bots are now available!
In this article, we will see why a short bot could be interesting, how it works, and how to trade safely.
Why use a short bot?
Just like a buy and sell bot, the idea of a short bot is to make a profit out of price action, but in a bear market.
For a buy and sell bot, we just need a simple spot trading wallet, ...


Ethereum is now trading at $2600 and this month saw a lot of volatility but mainly bearish as the price went from above the $3000 level down to the exact 0.236 Fibonacci level at $2130.
The August monthly candle is printing a long lower shadow and the close above or below the 24 months EMA will be crucial to indicate a global trend. It will be 3 bearish candles in a row, which has been the maxi ...
Welcome to our weekly analysis of the cryptocurrency space.
BTC/USDT
The BTCUSDT chart shows Bitcoin trading within a descending channel, with recent price action bouncing off the lower boundary of this channel, indicating potential support around the $53,000 level. The RSI indicates bullish divergence, suggesting a possible trend reversal or a strong bounce from this support level ...