Market Cap Analysis: BTC Dominance Rejected, Alt Season Ahead?
In this article, we will analyze the current state of the cryptocurrency market through the lens of market cap, BTC dominance, and major indices. We will also look at the potential for an alt season, the impact of the upcoming Bitcoin halving, and which coins are outperforming BTC in the long term. Finally, we will provide a short-term perspective on the price of Bitcoin.
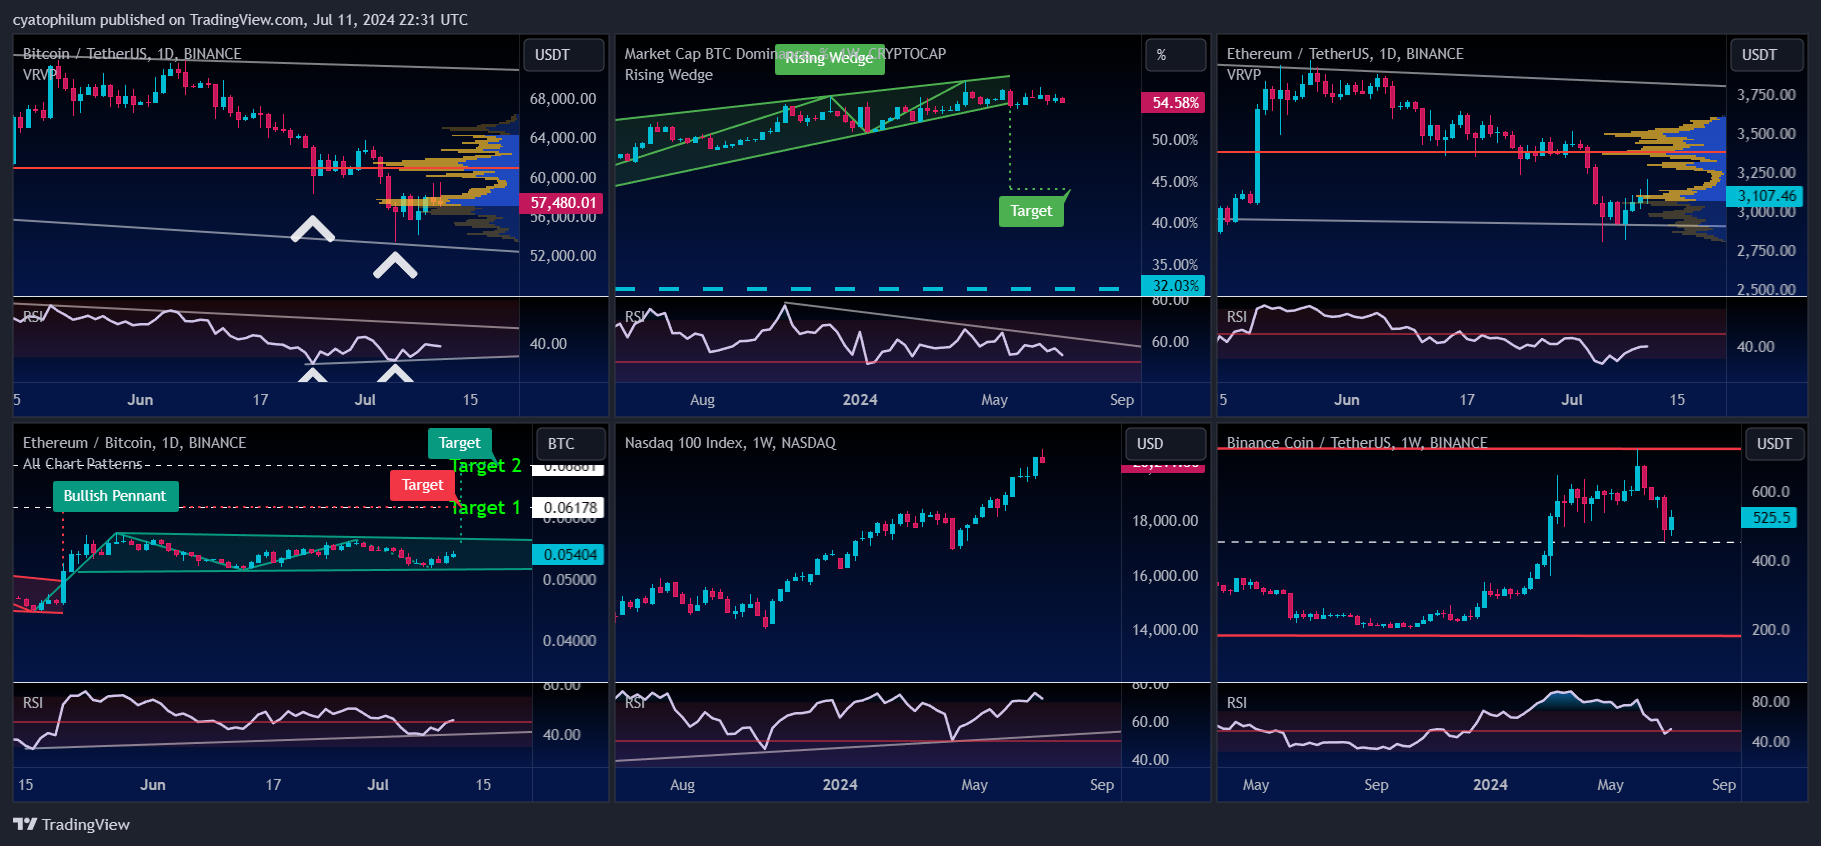
First, let's have a look at market cap.
The BTC dominance was rejected by resistance at 49% with this reverted hammer candle on week of April 23. It could mean the market cap will flow into altcoins. And, on the right chart, the RSI is oversold and getting closer to the 50 mark which is, on this 2 weeks chart, an indicator of alt season.
Now, if we look at the Total market cap, we can see that it significantly grows after a bitcoin halving. The next one is just in 1 year, so be patient!
It's also important to look at major indices, since they can impact the price of the crypto market. The S&P 500 is currently trading in a triangle, and seem to bounce on the top of it these last days. It could mean more action to the downside.
Here is my "BTC destroyers" chart, and right now, only ETH and BNB, and maybe MATIC are outperforming bitcoin on the long term.
Here is a bear's perspective on Bitcoin: I like to compare Bitcoin and Nasdaq price as they are strongly correlated. A double top is forming on Nasdaq price and could be bad news for BTC price.
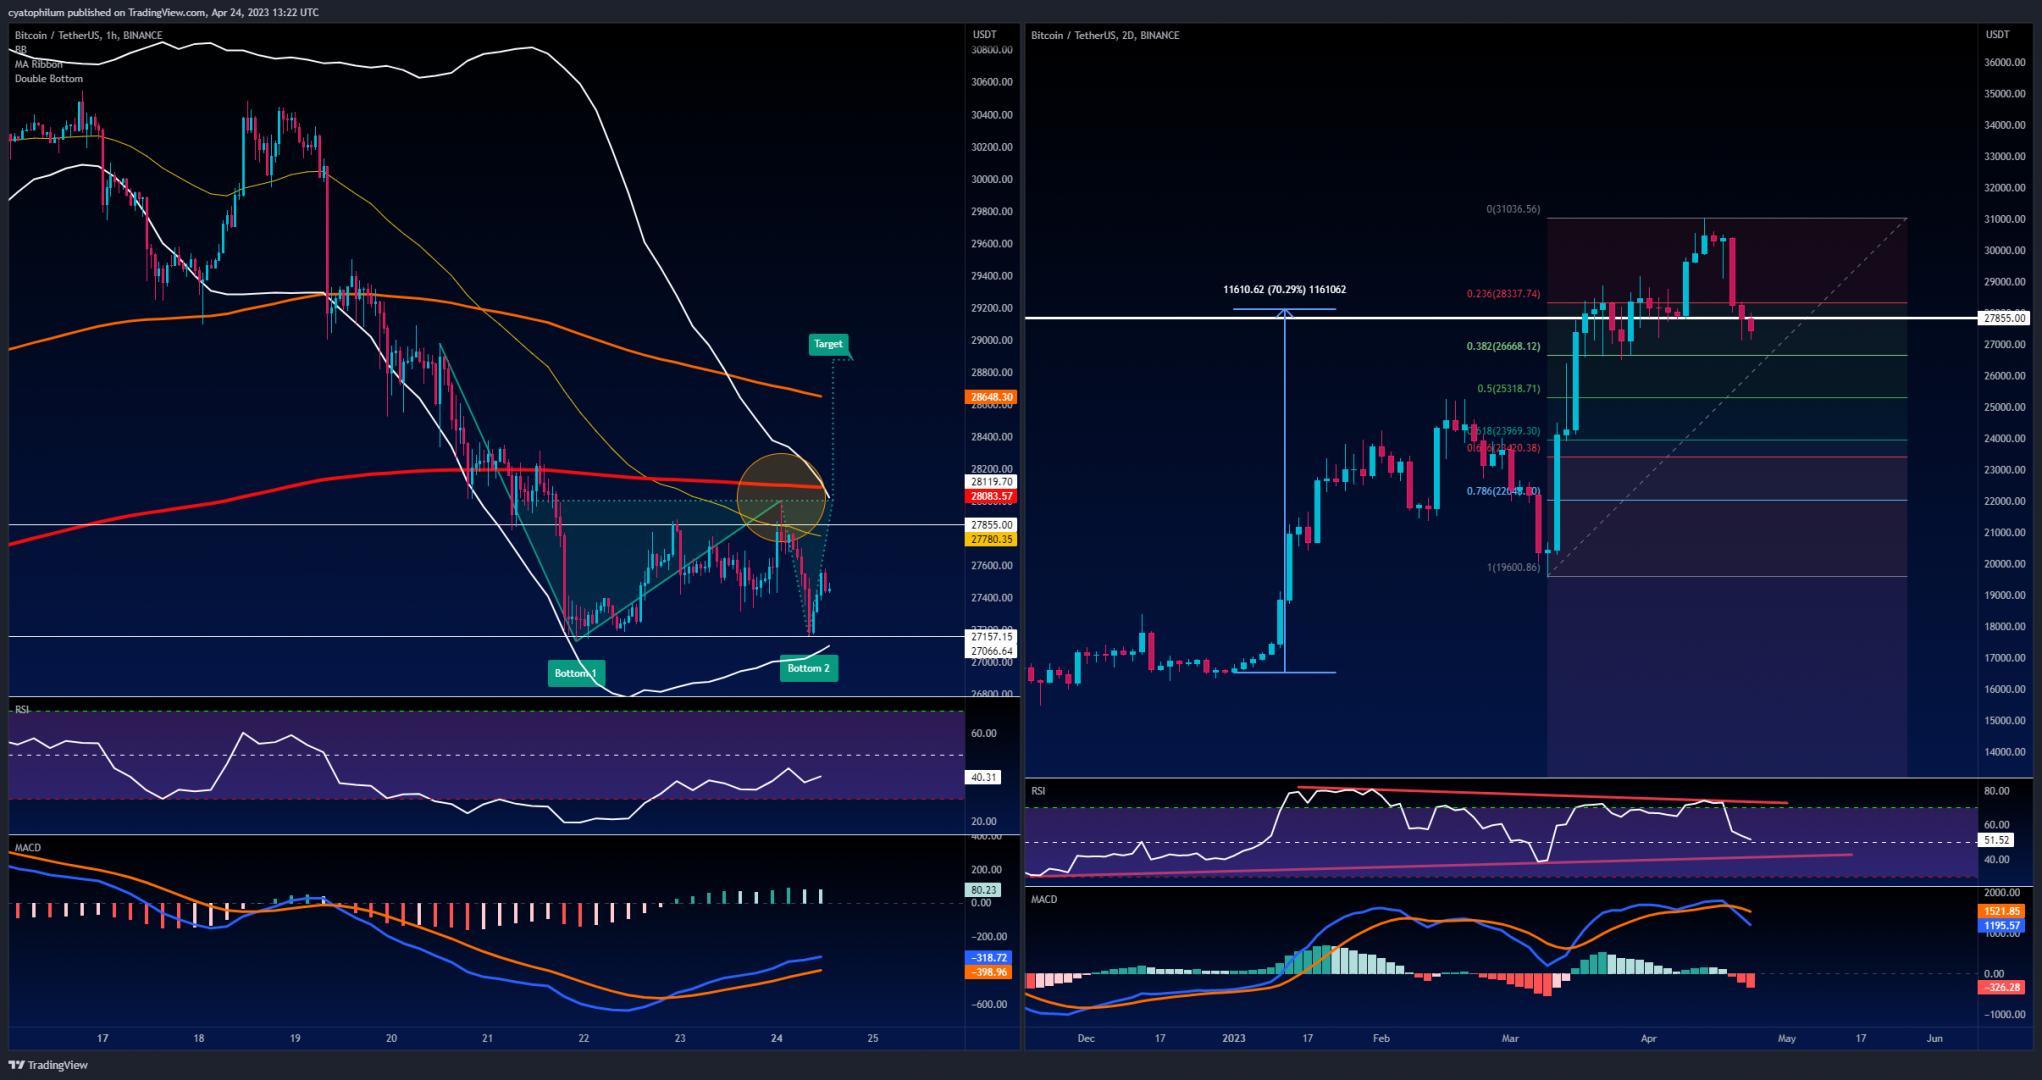
Now on the short term for Bitcoin: The 4 hour chart is printing a double bottom, it will be valid if price climbs back to 28 000$, the target will then be 28 880$. However the bigger trend is bearish, price currently below all moving averages, if price breaks below the bottom of last few day's range at 27 100$, next target for the bears is 26 660 given by fibonacci levels.
Written by Cyatophilum - Created 3 years ago - Last edited 3 years ago
Recent Articles

Introducing the "Trend or Range?" Indicator
Understanding market conditions is a cornerstone of successful trading. Whether you’re trading cryptocurrencies, stocks, or forex, identifying if a market is trending or range-bound can drastically enhance your strategy’s effectiveness. The "Trend or Range?" indicator is here to simplify this process.
What Is the "Trend or Range?" I ...
We are thrilled to announce that short bots are now available!
In this article, we will see why a short bot could be interesting, how it works, and how to trade safely.
Why use a short bot?
Just like a buy and sell bot, the idea of a short bot is to make a profit out of price action, but in a bear market.
For a buy and sell bot, we just need a simple spot trading wallet, ...


Ethereum is now trading at $2600 and this month saw a lot of volatility but mainly bearish as the price went from above the $3000 level down to the exact 0.236 Fibonacci level at $2130.
The August monthly candle is printing a long lower shadow and the close above or below the 24 months EMA will be crucial to indicate a global trend. It will be 3 bearish candles in a row, which has been the maxi ...
Welcome to our weekly analysis of the cryptocurrency space.
BTC/USDT
The BTCUSDT chart shows Bitcoin trading within a descending channel, with recent price action bouncing off the lower boundary of this channel, indicating potential support around the $53,000 level. The RSI indicates bullish divergence, suggesting a possible trend reversal or a strong bounce from this support level ...