TRON: Things always come in threes
Hello traders,
While Bitcoin is showing signs of weakness ...
... some alts like Tron (TRX) give really strong bullish signals.
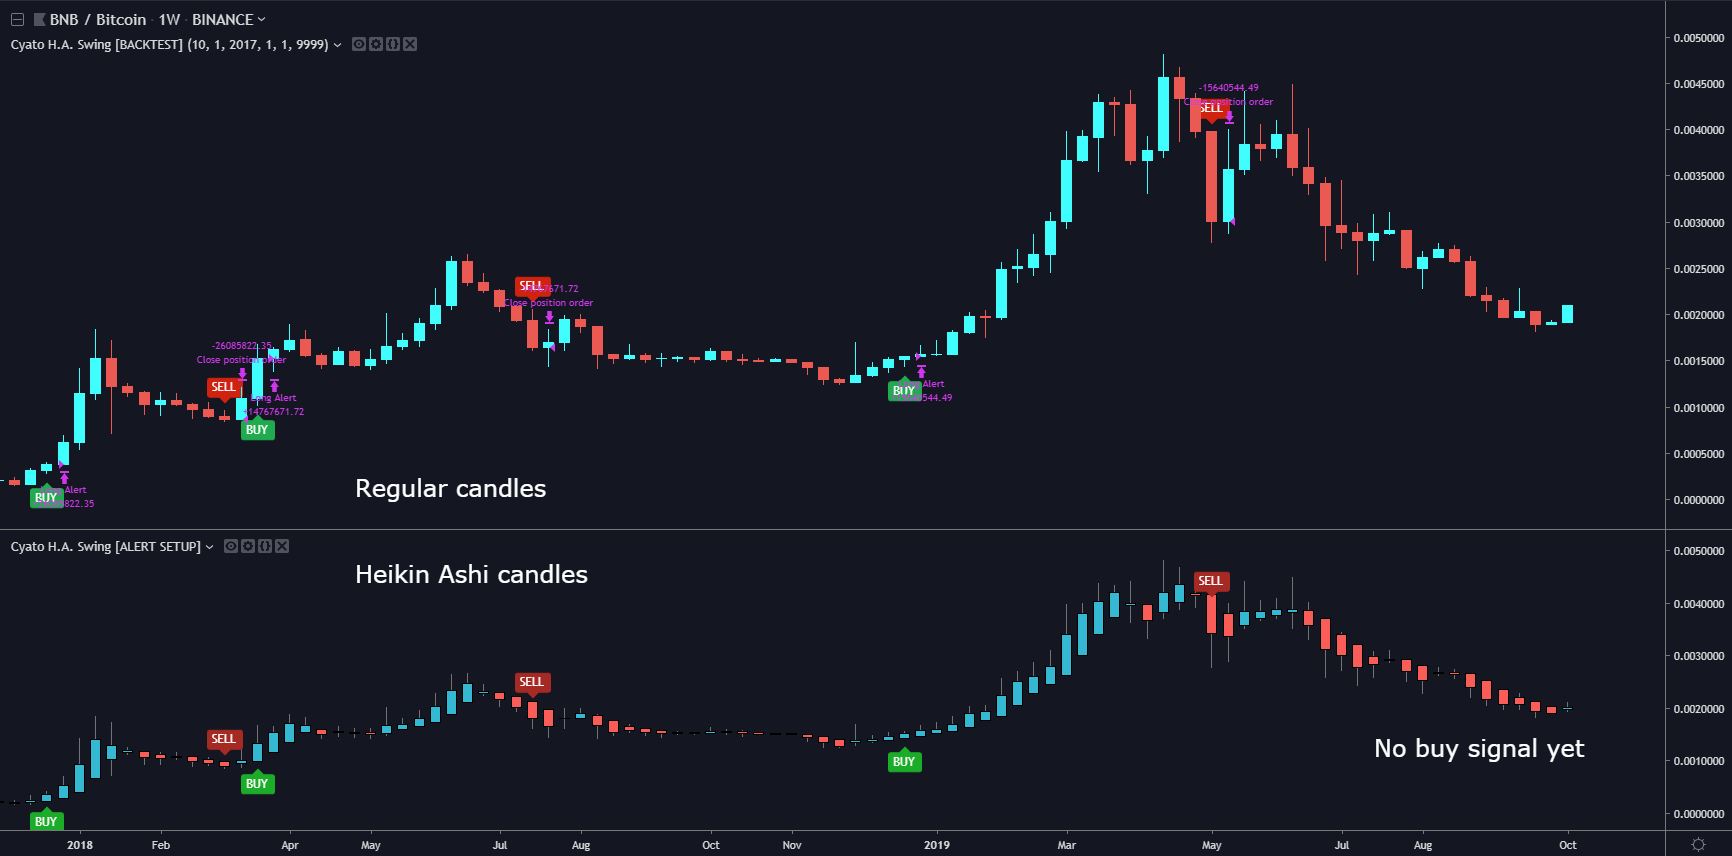
Here I used my Heikin Ashi Swing Trading Indicator on the weekly.
The last two buy signals in this setup have been followed by insane rallies in the past, and don't we say things always come in threes?
But staying in the weekly timeframe is a bit boring... I mean it's great for some swing trades but we don't have time right?
Let's dive in the 5 minute timeframe for some scalping on Bitmex!
Using my Scalping Bot Indicator, we've been able to make some quick profits already.

> Start using my indicators for either swing trading or scalping, manually or automated ! <
Indicators used:
Cyatophilum H.A. Swing [BACKTEST] by cyatophilum
Cyatophilum Scalping Bot [BACKTEST] by cyatophilum
Do you think TRON will outperform Bitcoin once again? Tell me in the comments!
Written by Cyatophilum - Created 7 years ago - Last edited today
Recent Articles

Introducing the "Trend or Range?" Indicator
Understanding market conditions is a cornerstone of successful trading. Whether you’re trading cryptocurrencies, stocks, or forex, identifying if a market is trending or range-bound can drastically enhance your strategy’s effectiveness. The "Trend or Range?" indicator is here to simplify this process.
What Is the "Trend or Range?" I ...
We are thrilled to announce that short bots are now available!
In this article, we will see why a short bot could be interesting, how it works, and how to trade safely.
Why use a short bot?
Just like a buy and sell bot, the idea of a short bot is to make a profit out of price action, but in a bear market.
For a buy and sell bot, we just need a simple spot trading wallet, ...


Ethereum is now trading at $2600 and this month saw a lot of volatility but mainly bearish as the price went from above the $3000 level down to the exact 0.236 Fibonacci level at $2130.
The August monthly candle is printing a long lower shadow and the close above or below the 24 months EMA will be crucial to indicate a global trend. It will be 3 bearish candles in a row, which has been the maxi ...
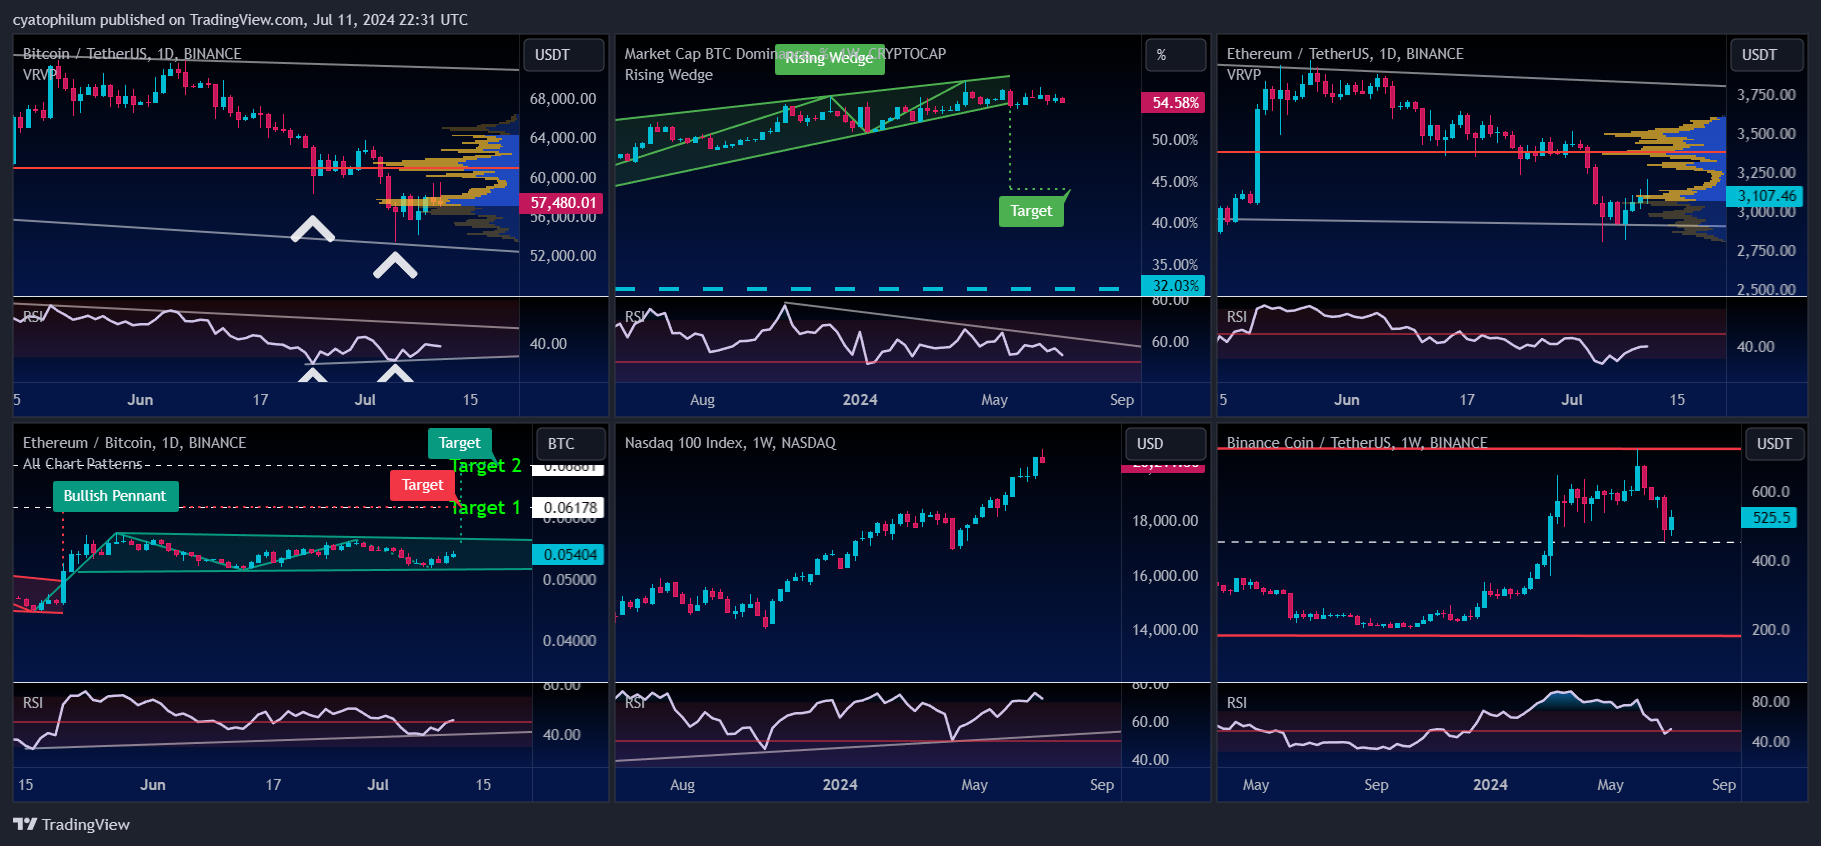
Welcome to our weekly analysis of the cryptocurrency space.
BTC/USDT
The BTCUSDT chart shows Bitcoin trading within a descending channel, with recent price action bouncing off the lower boundary of this channel, indicating potential support around the $53,000 level. The RSI indicates bullish divergence, suggesting a possible trend reversal or a strong bounce from this support level ...