Ultimate Trading Bot - Introduction
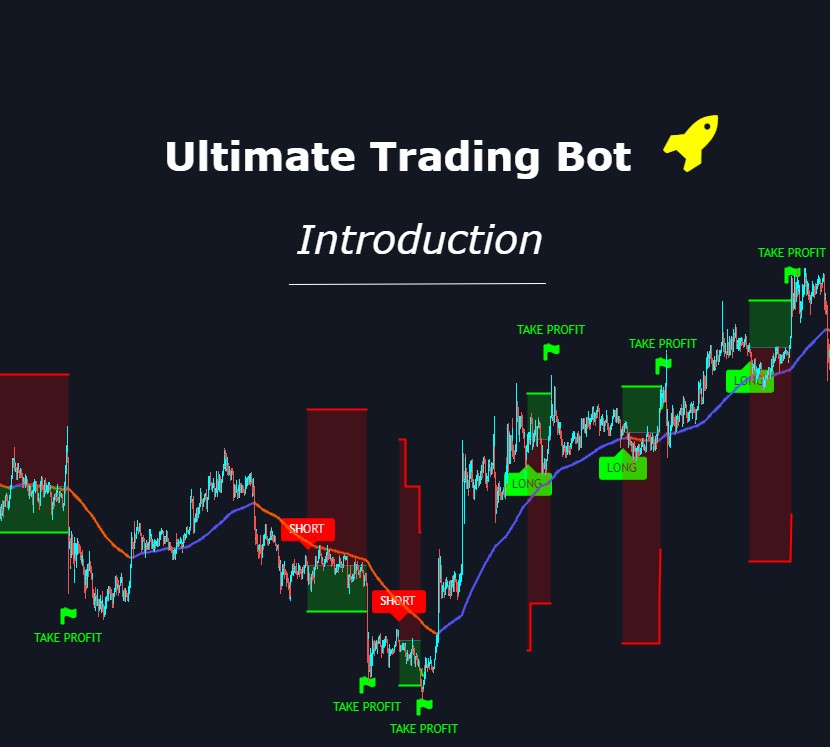
What is the Ultimate Trading Bot? How does it work? How to automate your trading? We are going to answer all these questions in this introduction post.
The purpose of the indicator
The UTB is a TradingView indicator which allows to create and use an infinite number of strategies.
It comes with two versions:
- The Backtest version allows to use the Strategy Tester. This is the version used to create a strategy. There will be a dedicated article on this version.
- The Alert Setup version allows to create automated alerts. This is how we receive notifications that tell us when to enter and when to exit a trade without having to look at the chart.
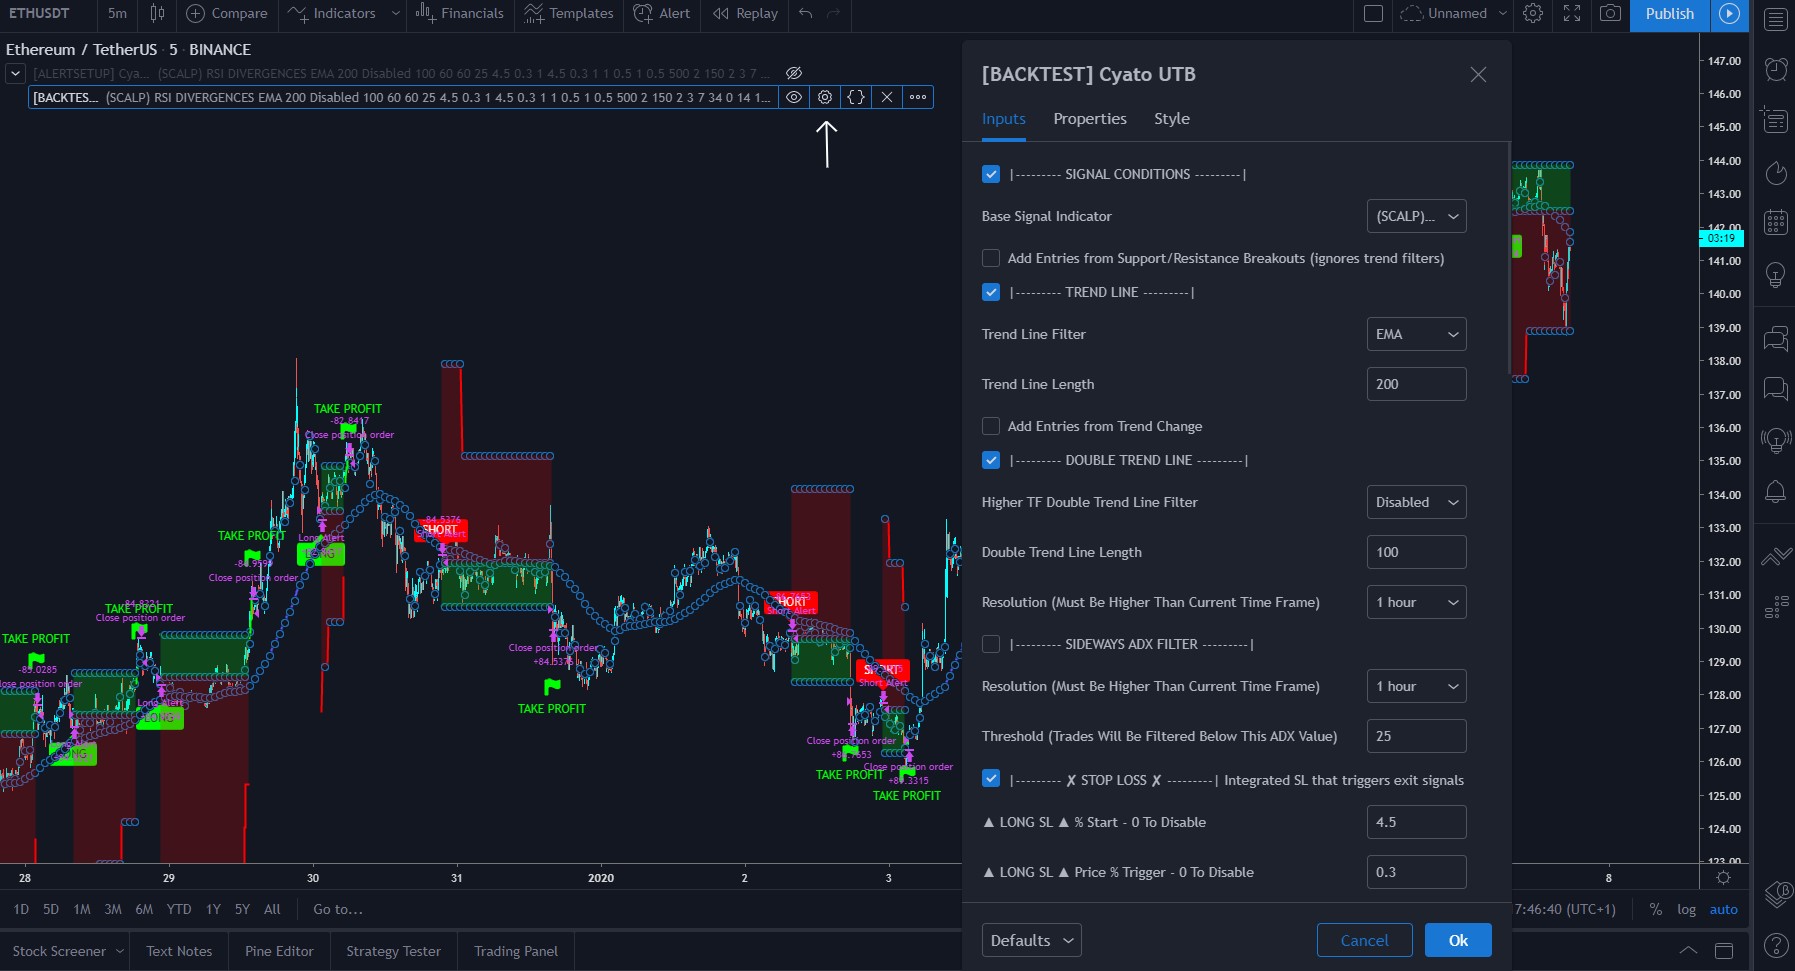
To configure the strategy, the user has access to a configuration panel with a set of features such as a trend detector, a sideways filter, a stop loss and take profit system, etc. The configuration panel is explained in detail on the indicator description page.
Requirements
In order to use the Ultimate Trading Bot, you must have a TradingView account and be subscribed to the Cyatophilum Indicators. You can subscribe here.
Which TradingView plan should I get?
If you trade manually, then the free plan can be enough. If you want to run multiple alerts, then a pro plan or higher is needed. Finally, if you want to backtest on a large amount of data, then a premium plan is much more effective. You can get a plan with this link.
Setting up the indicator for the first time
Once you subscribe to the Cyatophilum Indicators, you will receive a notification.
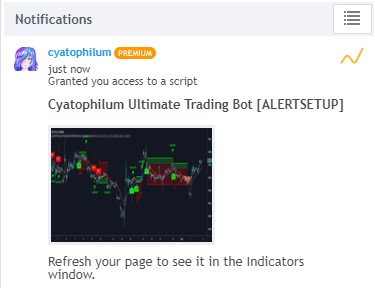
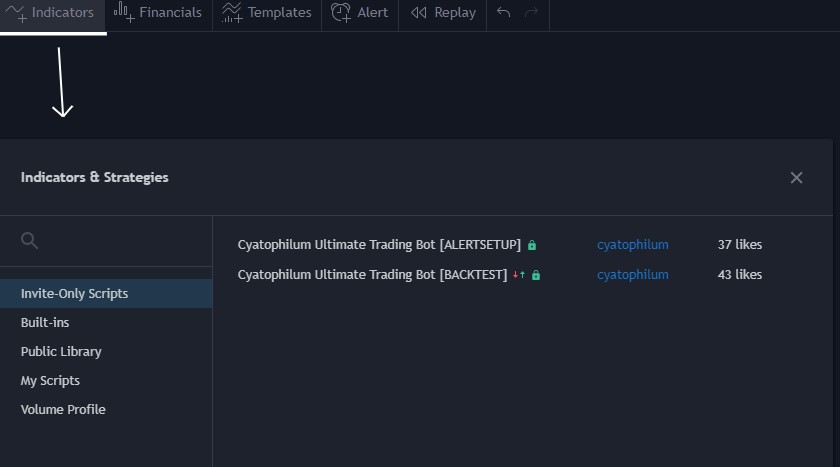
This means I have granted you access to the indicator. From this point you can add it on your chart. For this, once you are on the chart page, click on the indicators tab from the top menu. A popup will appear, and you will find the indicator in the Invite Only tab. Simply click on the indicator's name to add it to your chart.
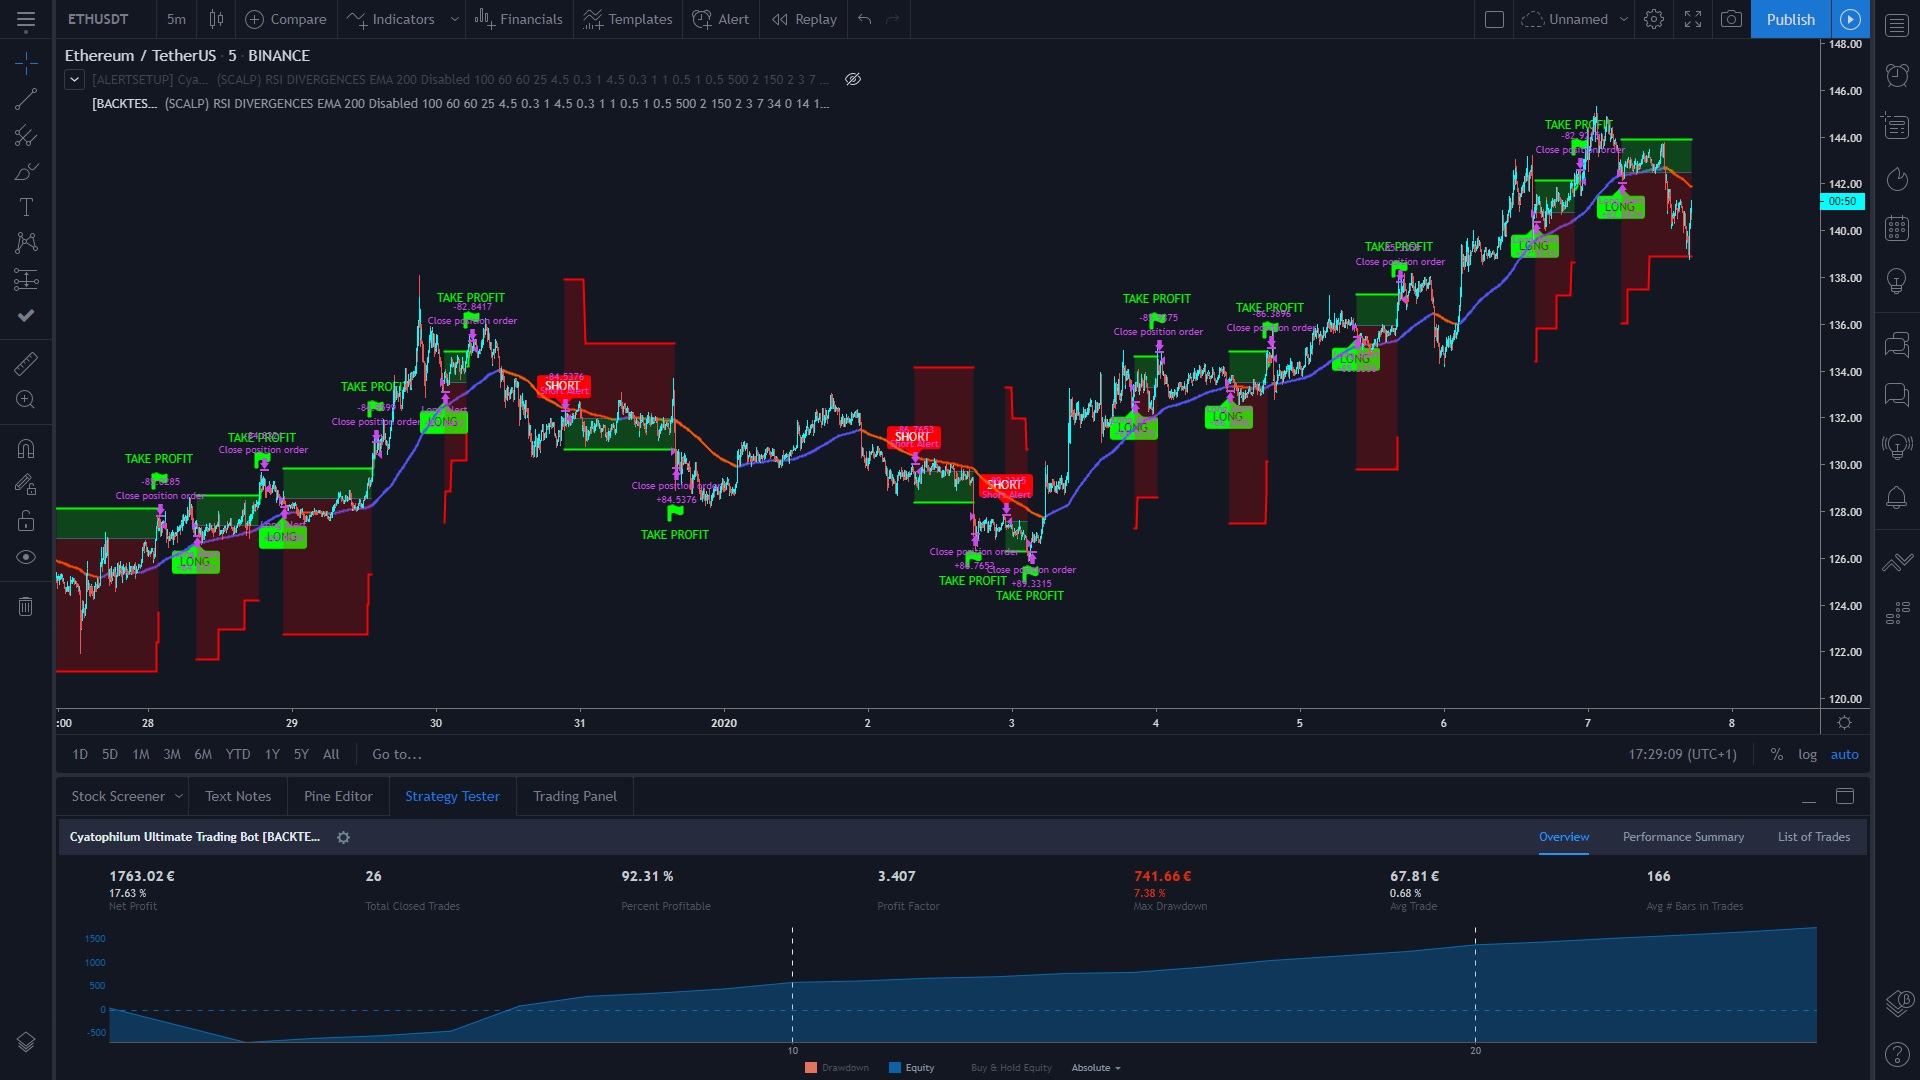
From this point you should now see the indicator's graphics. If you do not, try zooming out a little until you see a trade. In this example, we are on the Ethereum / ThetherUS chart of Binance in 5 minutes time frame.
You can now configure the indicator. For this, open the indicator's settings.
The next step, creating alerts will be explained in another post, or you can watch the video tutorials.
Written by Cyatophilum - Created 6 years ago - Last edited today
Recent Articles

Introducing the "Trend or Range?" Indicator
Understanding market conditions is a cornerstone of successful trading. Whether you’re trading cryptocurrencies, stocks, or forex, identifying if a market is trending or range-bound can drastically enhance your strategy’s effectiveness. The "Trend or Range?" indicator is here to simplify this process.
What Is the "Trend or Range?" I ...
We are thrilled to announce that short bots are now available!
In this article, we will see why a short bot could be interesting, how it works, and how to trade safely.
Why use a short bot?
Just like a buy and sell bot, the idea of a short bot is to make a profit out of price action, but in a bear market.
For a buy and sell bot, we just need a simple spot trading wallet, ...


Ethereum is now trading at $2600 and this month saw a lot of volatility but mainly bearish as the price went from above the $3000 level down to the exact 0.236 Fibonacci level at $2130.
The August monthly candle is printing a long lower shadow and the close above or below the 24 months EMA will be crucial to indicate a global trend. It will be 3 bearish candles in a row, which has been the maxi ...
Welcome to our weekly analysis of the cryptocurrency space.
BTC/USDT
The BTCUSDT chart shows Bitcoin trading within a descending channel, with recent price action bouncing off the lower boundary of this channel, indicating potential support around the $53,000 level. The RSI indicates bullish divergence, suggesting a possible trend reversal or a strong bounce from this support level ...