
Build your own Trading Bot or Use an existing strategy!
Trade any market with this powerful indicator.
How it works
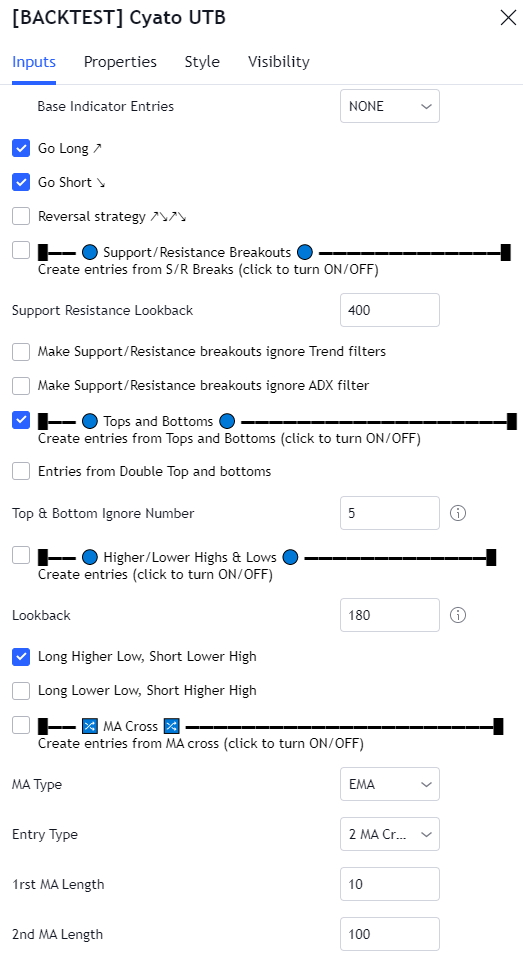
Custom entries
Choose between a list of technical indicators for your base entry condition.
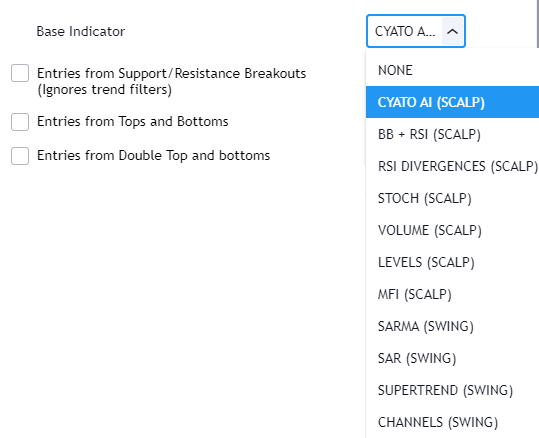
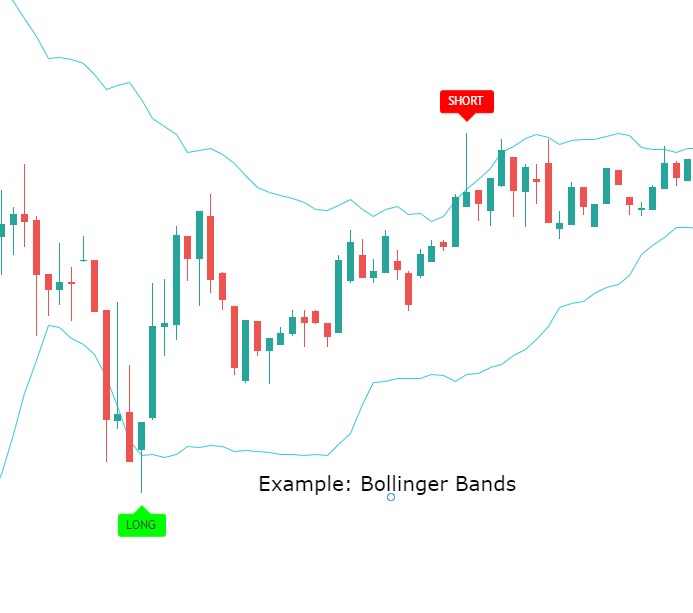
In this example, if we select the "(SCALP) BB+RSI" condition, it will create long and short entries based off the Bollinger Bands and RSI.
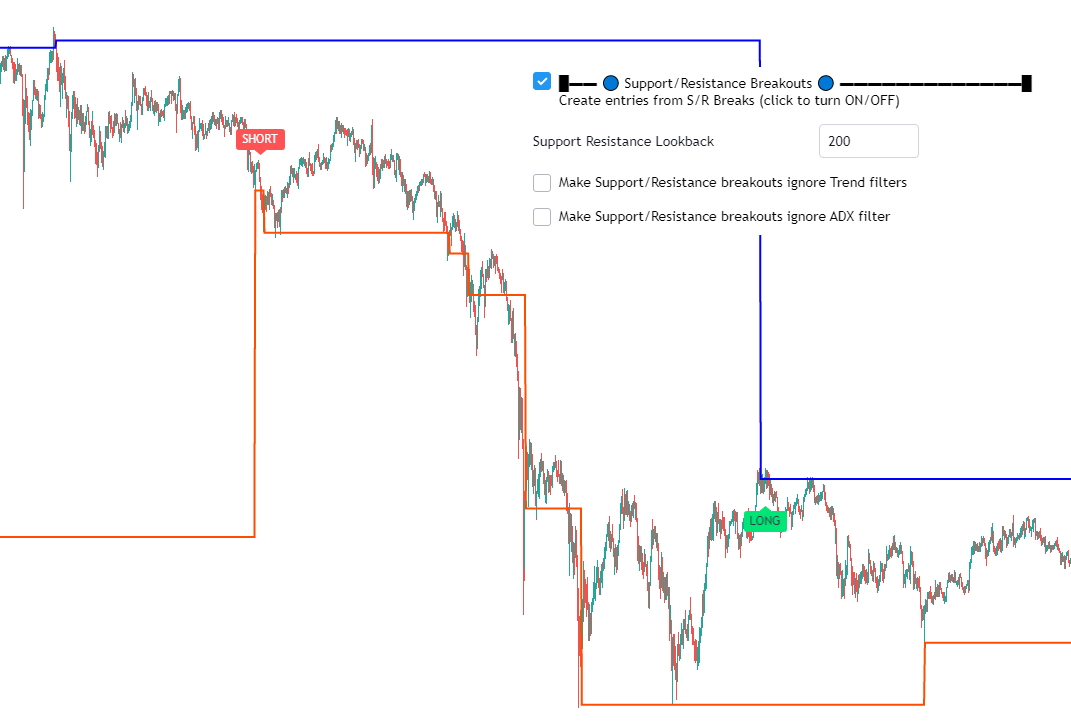
The Support & Resistance Breakouts feature is optionnal and can be used to create additional entries.
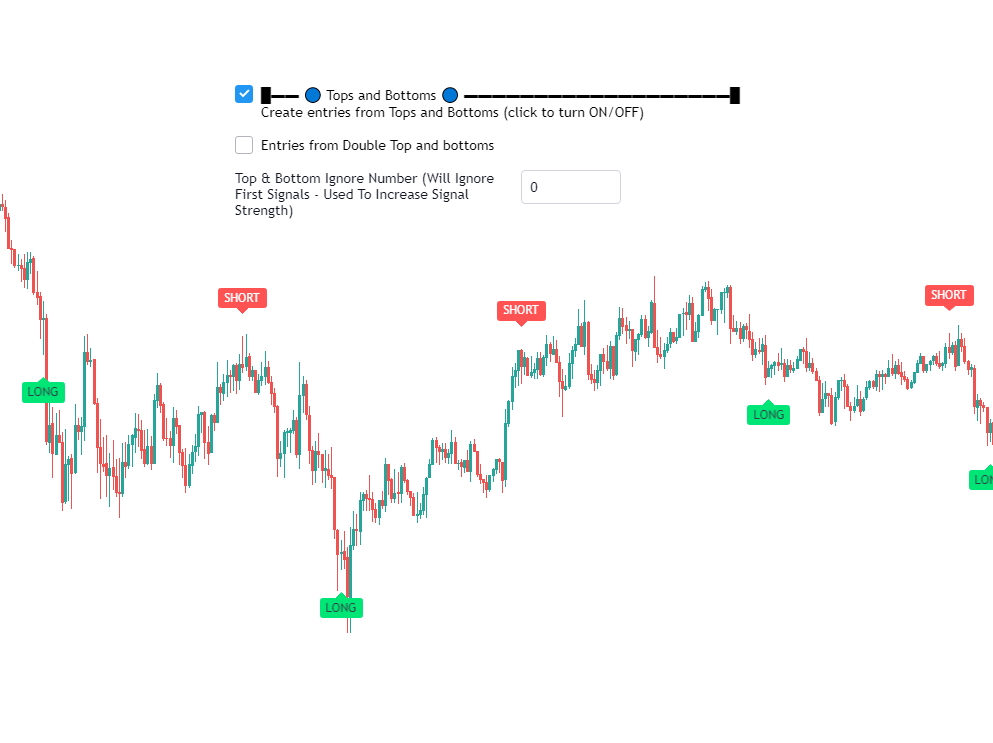
The Tops and Bottoms feature is great to catch dips in the market. The indicator used to find tops and bottoms is included in the subscription.
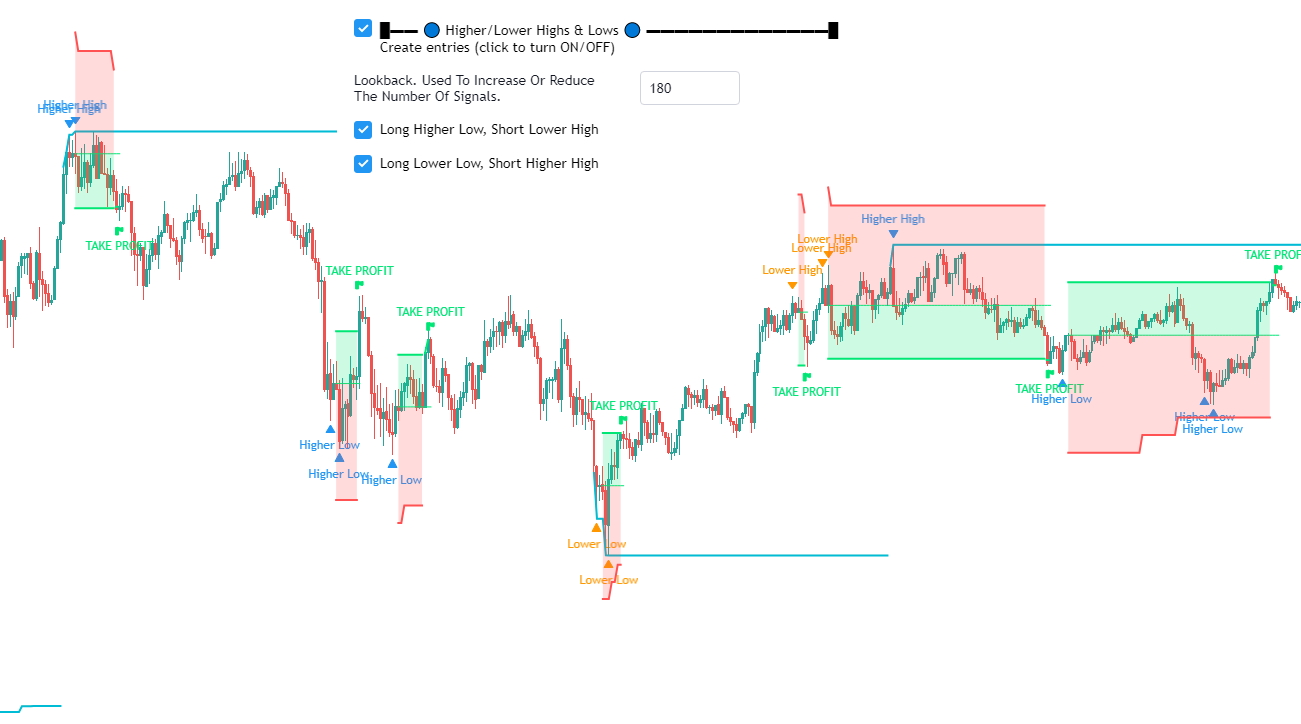
The Higher Highs, Lower Lows feature is another way to create entries. The indicator used is also included in the subscription.
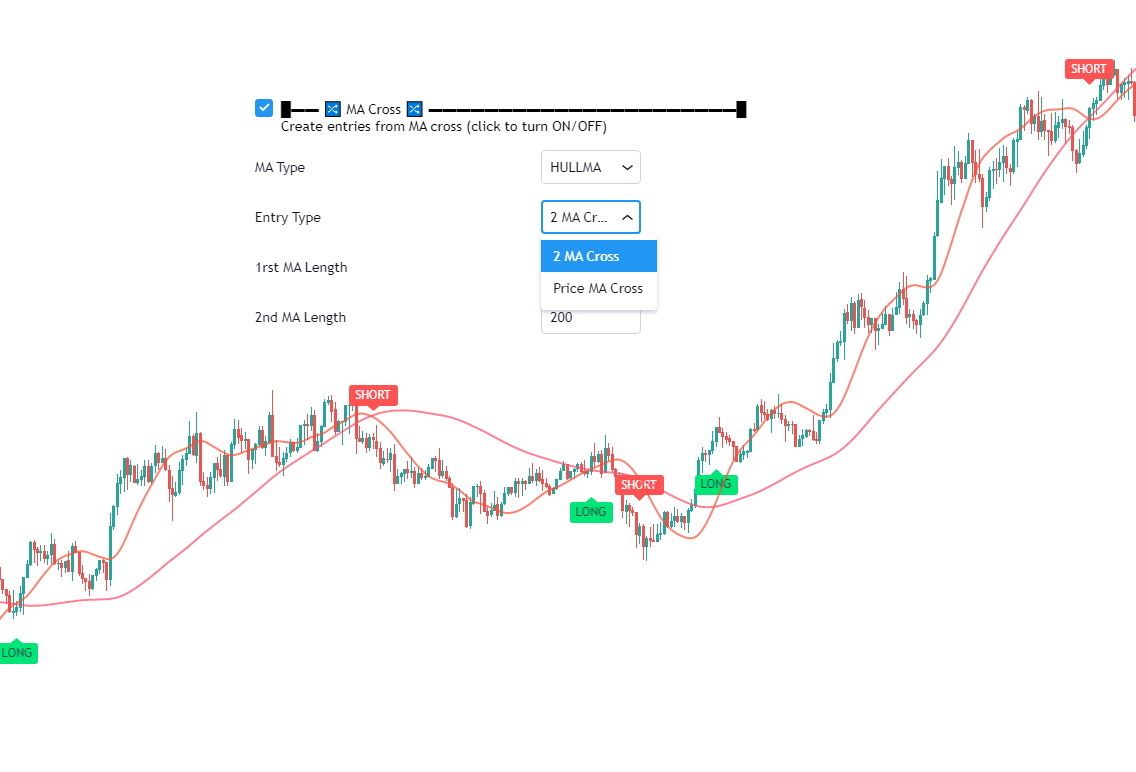
If you like to work with Moving Average Cross, you can choose from 10 different moving averages to create your strategy.
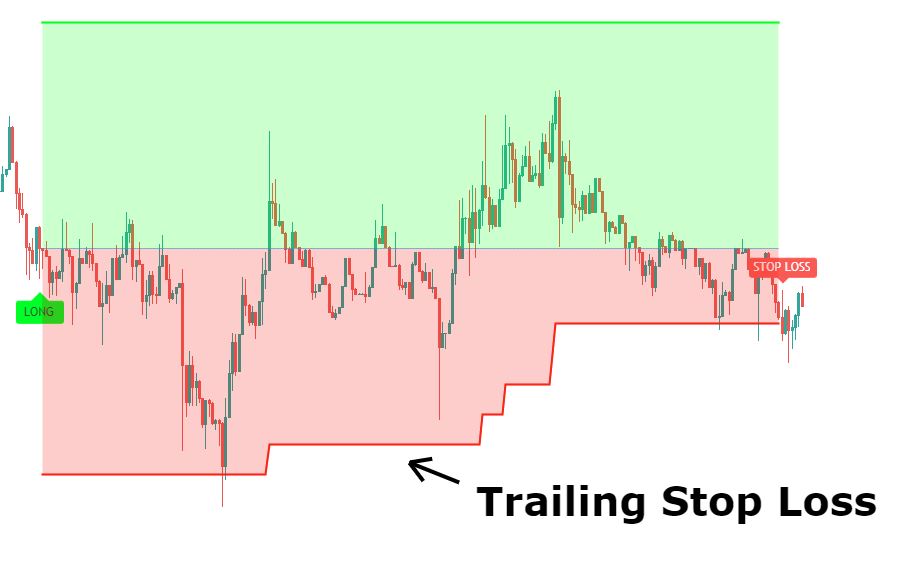
Stop Loss Feature
Stay safe. Configure your stop loss in TradingView! The integrated Stop Loss system will trigger an alert to exit the trade. You can secure your profits with the trailing system!
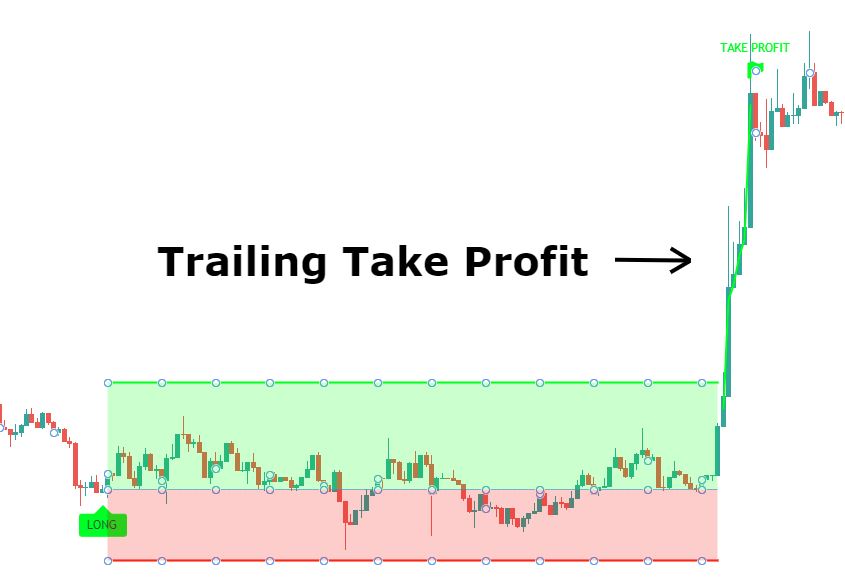
Trailing Take Profit
Secure your gains. The integrated Take Profit system will trigger an alert to exit the trade. Use the Trailing Take Profit feature to make even more profits!
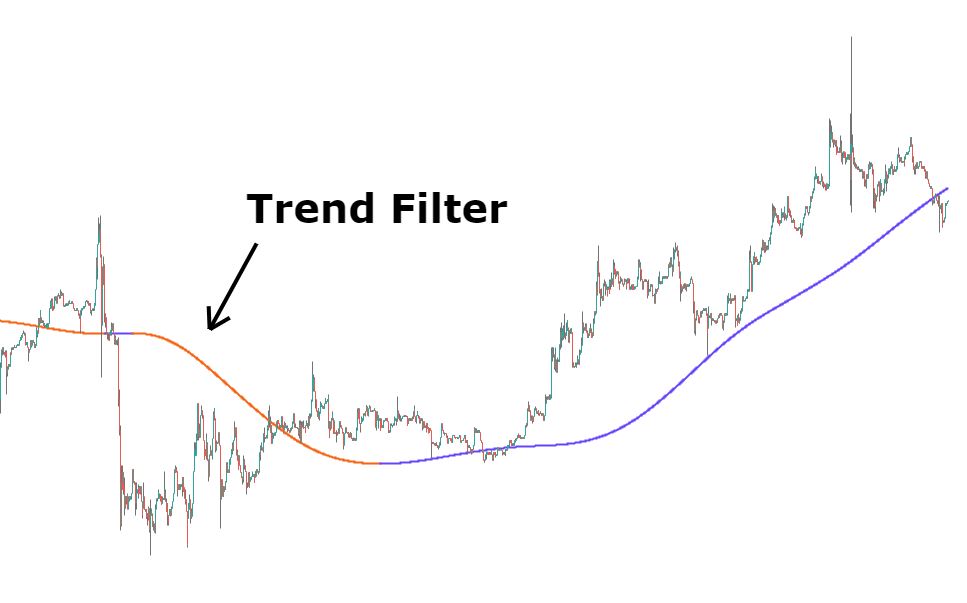
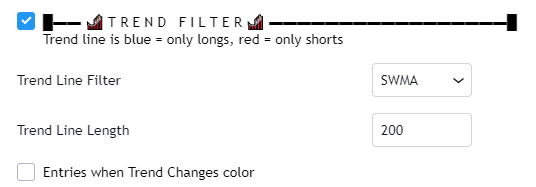
Trend Filter
Avoid trading against the market. You can choose between a set of trend lines that will filter entries going against the global trend.
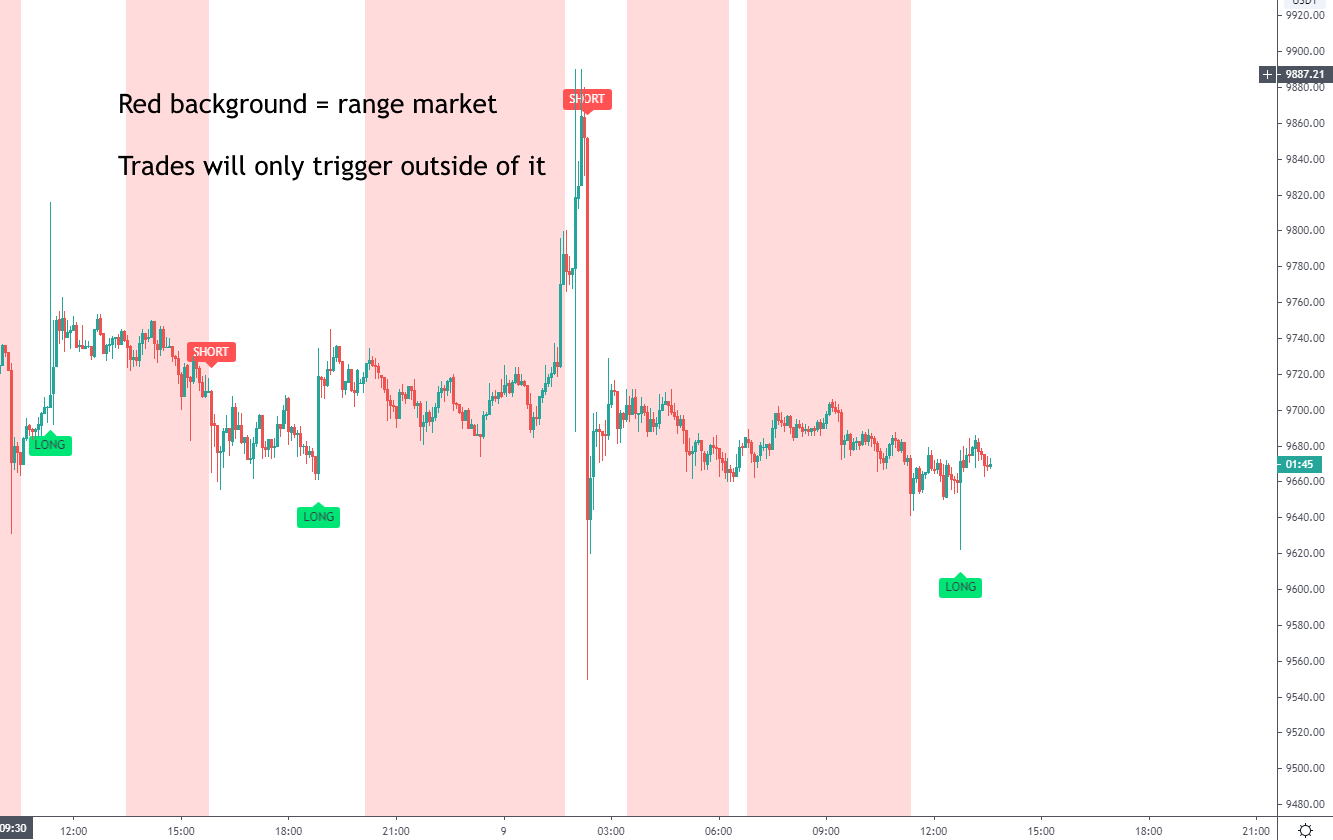
Sideways Filter
Practice has shown that entries triggered during flat markets were often less profitable than the others. That is why I decided to add this feature. Using the ADX, entries triggered below a certain threshold are filtered. You can see these areas in red background.
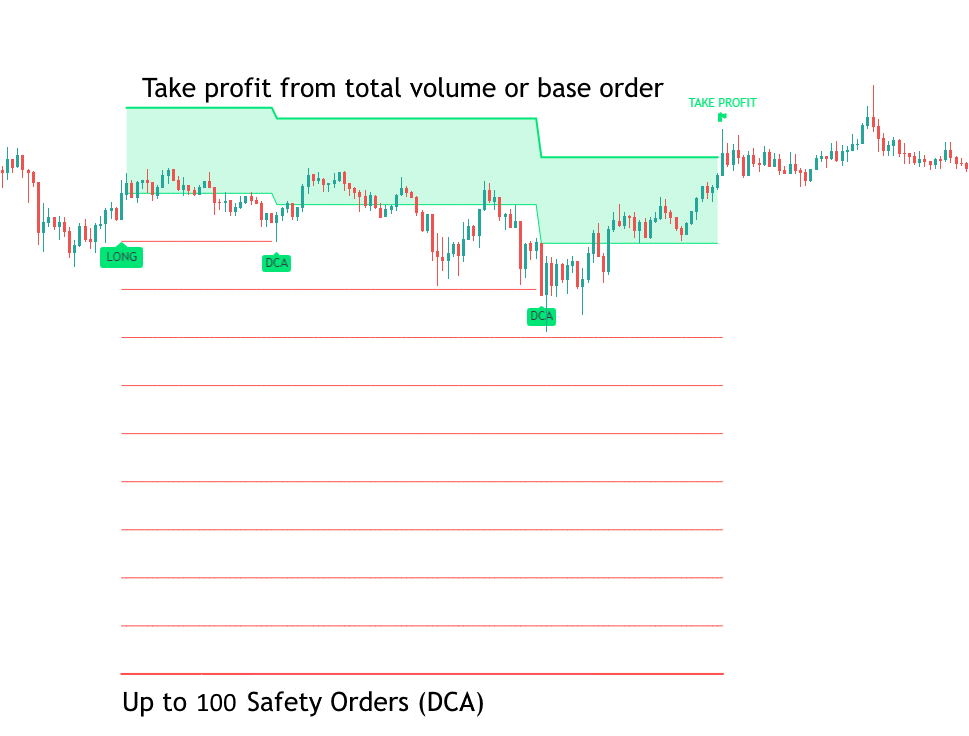
Safety Orders
Risk Management is key, especially when trading low timeframes, or scalping. Sometimes the price will go against you, and you can take advantage of that. Progressively add to your order as the DCA signals trigger, reducing the risk and making your target easier to reach.
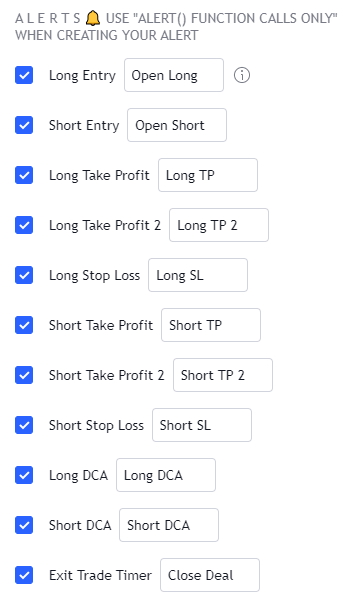
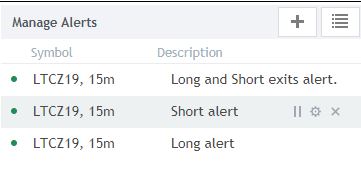
Automated Alerts
Receive alerts by sound, email or phone and more for every signal required to your trading. Know when to enter and when to exit without even looking at the chart! Up to 22 custom alerts to help you build any kind of strategy.
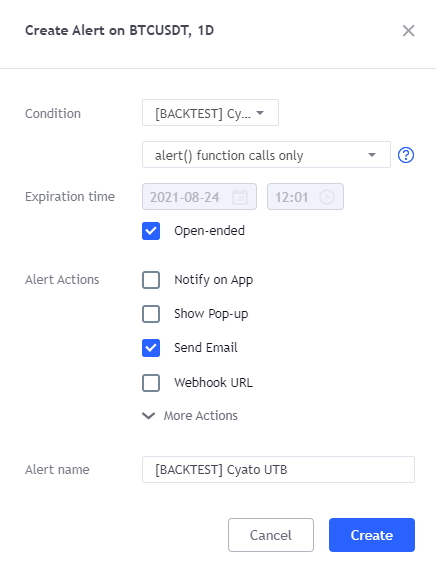
Creating Alerts
The indicator is using the newest alert system:
1. Write your alert messages in the indicator settings (alert section at the bottom)
2. Click "Create Alert" as usual, but choose "alert() function calls only"
3. Give you alert a name
How to use this indicator ?
How to backtest
You can backtest using the Strategy Tester which will give you a quick overview of the strategy results over the given period of time.
There is also a backtest panel built in the indicator that gives more detailed information such as the daily % or the Buy & Hold comparator.
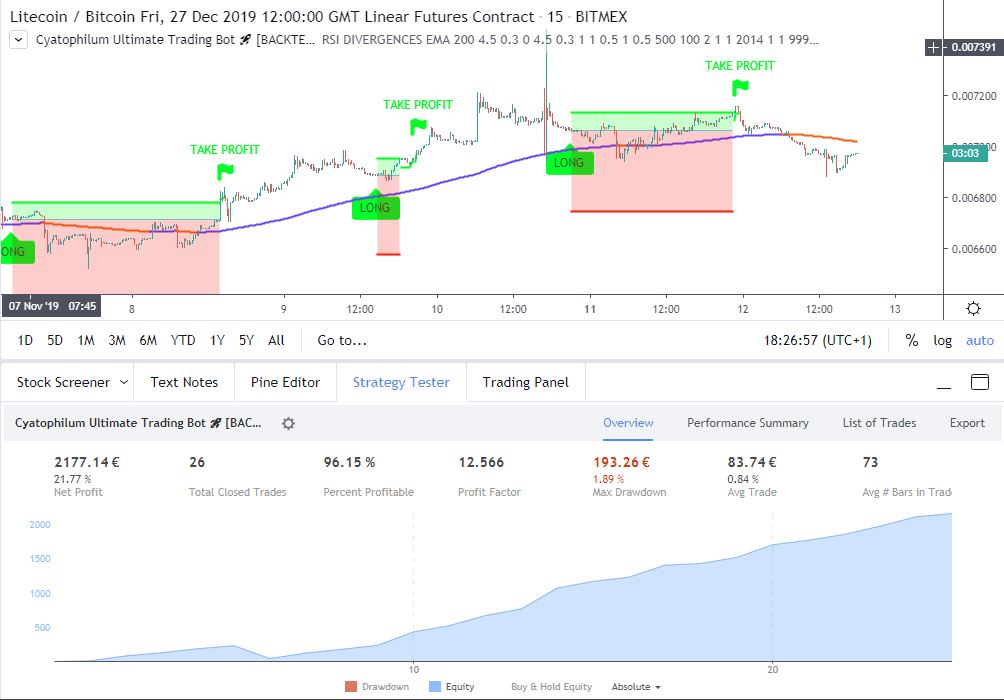
Backtest and make it run!
This indicator allows to backtest the strategy and to create automated alerts.
Pre-configured charts, ready to use
If you do not feel like creating your own strategy, you can pick up one of the many already created by the community.
These charts are available on my Discord Channel
Advanced User Guide
Signal Condition
Choose between several technical indicators for your base entry condition.
| Parameter | Description |
|---|---|
| Base Signal Indicator | Build your entry from built-in Scalping or Swing trading indicators. |
| Support/Resistance Breakouts | Can be turned ON and OFF. The script calculates the last support resistance line, and breakouts can be used as additionnal entry or can be used alone. |
| Tops & Bottoms | Can be turned ON and OFF. Using this indicator, the script will find tops and bottom. Combined with the trend filters, you can get really nice entries. |
| Higher/Lower Highs/Lows | Can be turned ON and OFF. Using this indicator, the script will create entries from new highs and lows. |
| MA Cross | Can be turned ON and OFF. Create entries from 2 Moving Average cross or from price crossing with a Moving Average. |
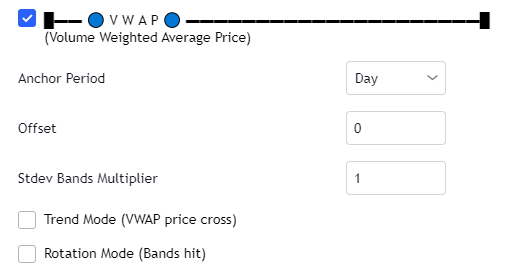
| Parameter | Description |
|---|---|
| VWAP | Can be turned ON and OFF. Create entries from VWAP rotation or trend mode. |
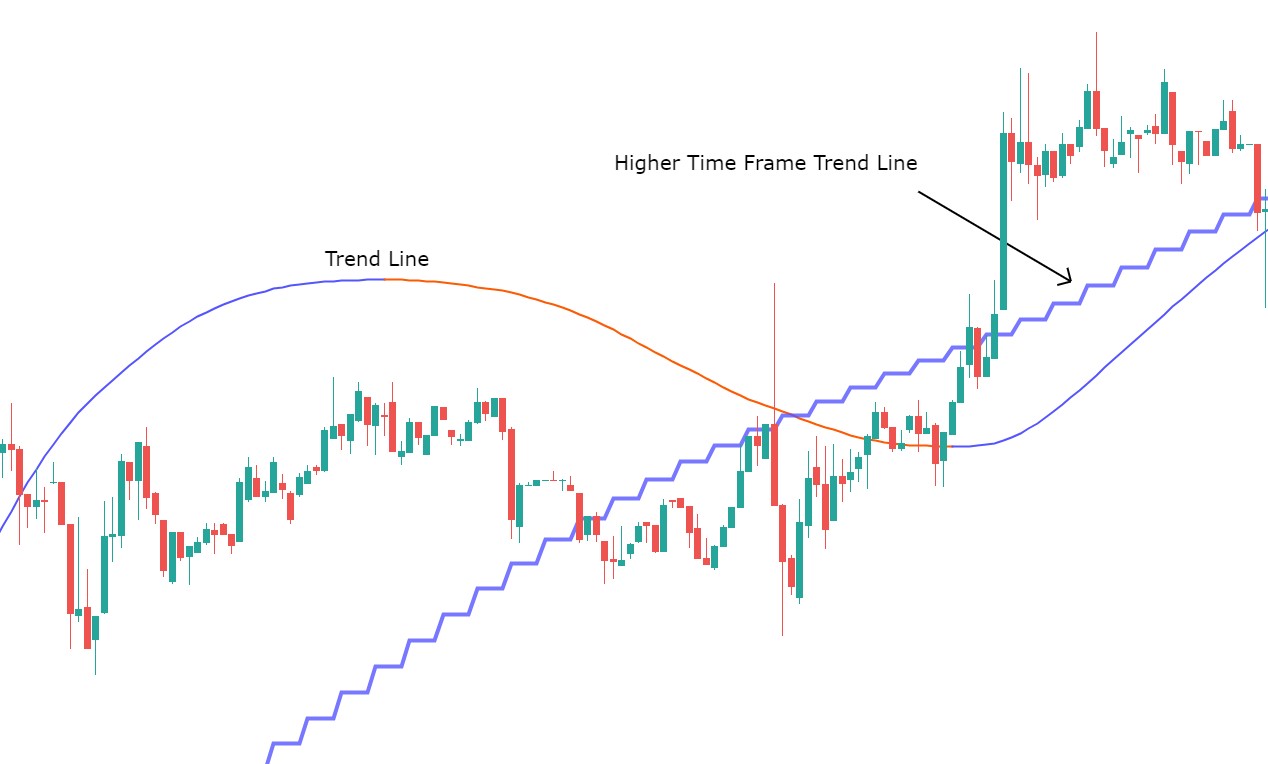
Signal (Trend) Filter
Choose between several trend lines. The trend line will filter the trades going against it.
| Parameter | Description |
|---|---|
| Trend Line Filter | Choose between Tilson T3, EMA, SMA, WMA, HULLMA and more to create a trend line. |
| External Trend Line | Source for an External Trend Line. You can use any other indicator as a trend line. |
| Trend Line Length | Length of the trendline in bars back. |
| Trend Condition | Choose between "SLOPE CHANGE" or "CROSSOVER" to determine how the trend is calculated. |
| Create Entries when Trend changes color | Can be turned ON/OFF. Creates a signal when the trend reverses. |
| Exit Trade when Trend changes color | Can be turned ON/OFF. Creates an exit signal when the trend reverses. |
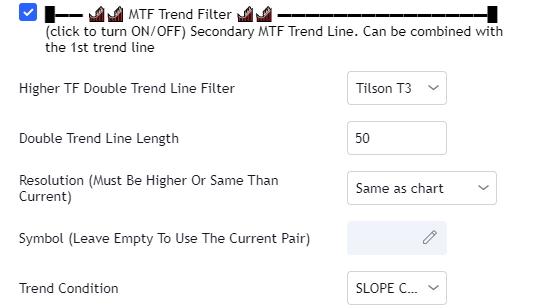
Signal Higher Time Frame (Trend) Filter
Request data from a higher time frame. Choose between several trend lines. The trend line will filter the trades going against it.
| Parameter | Description |
|---|---|
| Trend Line Filter | Choose between Tilson T3, EMA, SMA, WMA, HULLMA and more to create a higher time frame trend line. |
| Double Trend Line Length | Length of the trendline in bars back. |
| Resolution | Time frame for the trend line. Usually higher than the current time frame. |
| Symbol | You can use the trend line from another symbol! |
| Trend Condition | Choose between "SLOPE CHANGE" or "CROSSOVER" to determine how the trend is calculated. |
Sideways ADX Filter
Filter trades when the market is going sideways. Use this free tool to configure the ADX filter to your liking.
| Parameter | Description |
|---|---|
| Resolution | Time frame for the ADX. Usually a higher time frame than current. |
| Threshold | Trades will be filtered when the ADX is below this value. |
| Filter Trades Condition | Choose how trades will be filtered. Is it when ADX is below or above this value? |

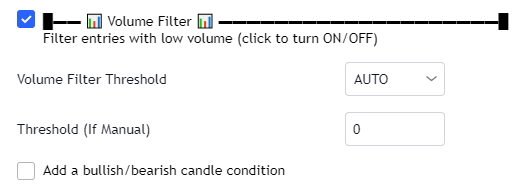
Volume Filter
Filter trades when the volume is too low.
| Parameter | Description |
|---|---|
| Volume Filter Threshold | Choose between "AUTO" or "MANUAL". "AUTO" mode will use a moving average while "MANUAL" lets you input a threshold under which trades will be filtered. |
| Threshold | Trades will be filtered when the volume is below this value. |
| Bullish/Bearish Condition | Add a condition to only trigger a long when the candle is bullish and a short when bearish. |
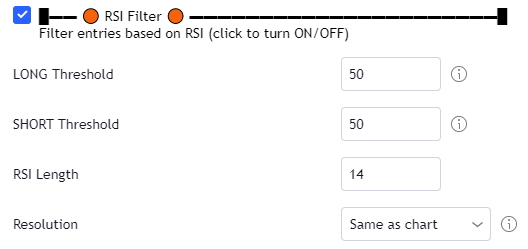
RSI Filter
Filter trades based on the RSI.
| Parameter | Description |
|---|---|
| LONG Threshold | Filter Long entries who are above this threshold. |
| SHORT Threshold | Filter Short entries who are below this threshold. |
| RSI Length | Length in bars for the RSI. |
| Resolution | Resolution for the RSI (Must be higher or same as current chart to avoid repainting). |
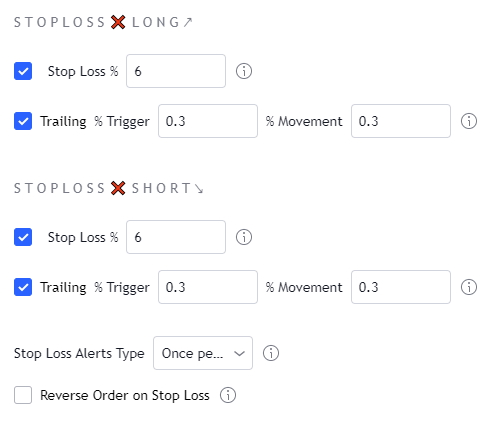
Stop Loss
Add a stop loss to the strategy. You can also make it trail.
| Parameter | Description |
|---|---|
| Stop Loss % | Starting Value for LONG/SHORT stop loss. |
| Trailing % Trigger | First parameter related to the trailing stop loss. Percentage of price movement in the right direction required to make the stop loss line move. |
| % Movement | Second parameter related to the trailing stop loss. Percentage for the stop loss trailing movement. |
| Stop Loss Alerts Type | If you use Once Per Bar Close, the strategy will ignore candle wicks, and only consider a stop loss at bar close. Using Once Per Bar, the strategy will take inside bar movement into account. |
| Reverse order on Stop Loss | Use this if you want the strategy to trigger a reverse order when a stop loss is hit. |
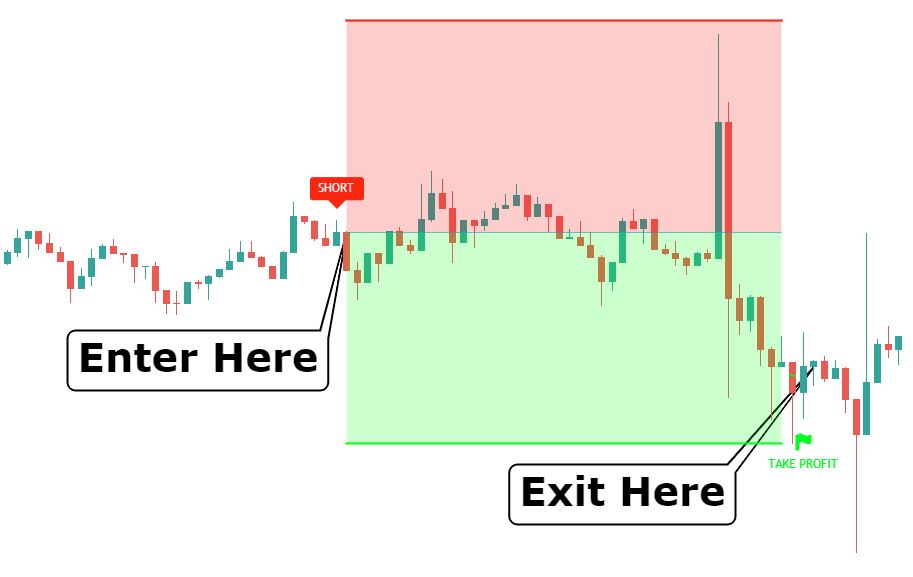
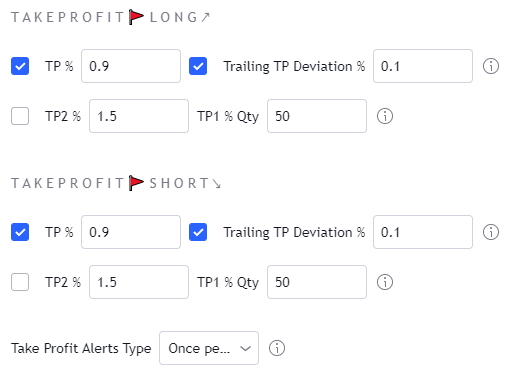
Take Profit
Add 1 or 2 take profit targets to the strategy. You can also make it trail.
| Parameter | Description |
|---|---|
| TP % / TP 2 % | Take profit value in percentage of price. |
| Trailing TP Deviation % | Percent deviation for the trailing take profit. |
| TP1 % Qty | When using 2 TPs, choose the quantity to exit on the 1rst TP. The 2nd TP will exit the remaining quantity. |
| Take Profit Alerts Type | If you use Once Per Bar Close, the strategy will ignore candle wicks, and only consider a take profit at bar close. Using Once Per Bar, the strategy will take inside bar movement into account. |
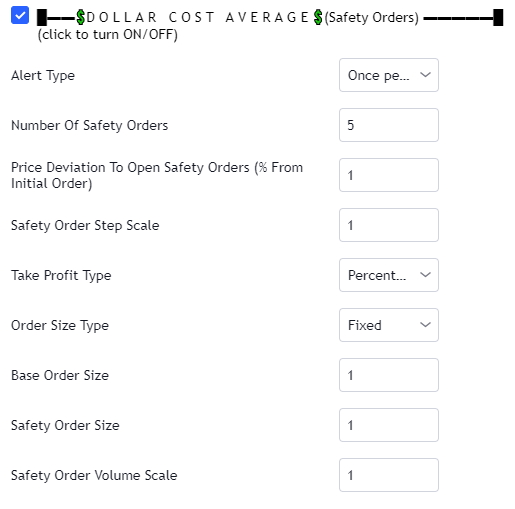
Safety Orders
Make the strategy trigger additional orders, also known as Dollar Cost Average.
| Parameter | Description |
|---|---|
| Alert Type | If you use Once Per Bar Close, the strategy will ignore candle wicks, and only consider a stop loss at bar close. Using Once Per Bar, the strategy will take inside bar movement into account. |
| Number of Safety Orders | Up to 100, choose how many safety orders the strategy should trigger max. Each red line corresponds to a safety order position. If the price crosses these lines, the corresponding alert will trigger. |
| Price Deviation to open Safety Orders | Choose the distance from the base order in % of price to open the first safety order. |
| Safety Order Step Scale | Choose the distance in % of price between each safety order. |
| Take Profit Type | Choose between Percentage from total volume or Percentage from base order. |
| Order Size Type | Choose between "Fixed" or "% Equity". |
| Base Order Size | Quantity for the base order, which is the long/short first entry before any safety order. |
| Safety Order Size | Quantity for the safety orders. |
| Safety Order Volume Scale | Same as 3commas'. |
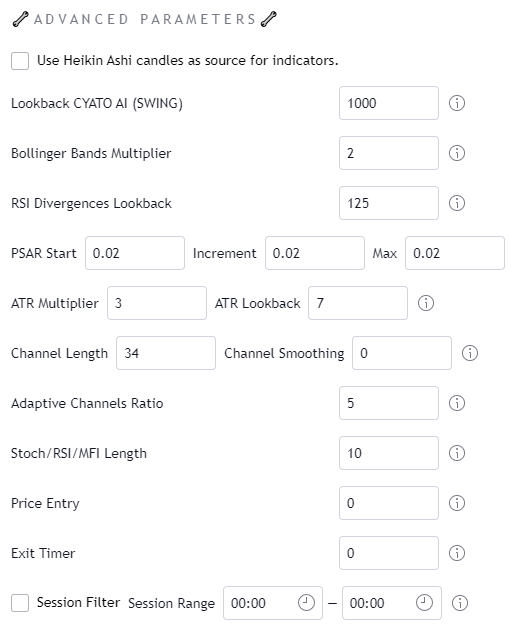
Advanced Parameters
A little fine-tuning.
| Parameter | Description |
|---|---|
| Use Heikin Ashi candles as source for indicators. | Turn it ON to inject Heikin Ashi candle Open/High/Low/Close data into the base indicators. We use this instead of the Heikin Ashi chart because backtesting is not accurate on these charts, and we want real price values for the Stop Loss/Take Profit system |
| Lookback CYATO AI (SWING) | Used with the CYATO AI (SWING) base indicator. It is the length in bars used to calculate the bands. |
| Bollinger Bands multiplier | When using the "BB+RSI" entry condition, this parameter will change the Bollinger Bands indicator multiplier. Increase it to strenghten your entries, and reduce it to get more entries. |
| RSI Divergences Lookback | Used with the RSI Divergences entry condition. Increase it to strenghten your entries, and reduce it to get more entries. |
| PSAR Values | Used with the SARMA and SAR entry conditions. Increasing it will get you more entries, while reducing it will strengthen the entries. |
| SuperTrend ATR Multiplier | Used with the SuperTrend SWING entry. Changes the ATR Multiplier. |
| SuperTrend ATR Lookback | Used with the SuperTrend SWING entry. Changes the ATR Lookback. |
| Channel Length | Used with the Channels SWING entry. Changes the Donchian Channel Length. |
| Channel Smoothing | Used with the Channels SWING entry. Changes the Donchian Channel Smoothing. |
| Adaptive Channel Ratio | Used with the Adaptive Channels SWING entry. Increasing it will get you more entries. |
| Stoch/RSI Length | Length used to calculate the RSI and Stochastic in the "RSI Divergences", "BB+RSI" and "STOCH" entries. Increasing it will strengthen the entries. |
| Price Entry | Used to create an entry when price reaches a simple value. |
| Exit Timer | Avoid staying too long in a trade with this feature. Make the strategy trigger an exit signal if the trade lasts more than x bars. |
| Session Filter | Create a range to only trade during your session. |
Private Discord Server: https://discord.gg/RVwBkpnQzm