Binance Coin : The Time has come
FUNDAMENTAL ANALYSIS
What is Binance Coin?
With a current market cap of $2 642 927 978 USD, BNB, the Binance Coin is one of the few Altcoins with a real use case, and thus a real intrinsic value. Right now the coin is working on Binance's proprietary Blockchain's Binance Chain. Its primary use is to provide an alternative ways for traders to pay for fees charged by the exchange, by offering a discount that decreases over time.
It has a circulating supply of 155 536 713 BNB, and Binance team has a goal to keep reduced the number of coins (thus increasing their value) by proceeding to a "Burn" each quarter of a year, and guess what, the next one is tomorrow: the 10th October (last year's one was on the 10th of October so I guess it will be the same this year).
So that was the big news that should hit the price, but there is another:
Today is the Binance meetup in Riga, Latvia, where the devs will be talking about new features with their exchange: Futures, Marginal trading, New Referral system, Lending platform etc.
TECHNICAL ANALYSIS
Let's move to the charts :)
Here I will work on BNB/BTC charts, as I am bullish on Bitcoin long term and we are interested in holding coins who perform better than BTC. I rarely look at the USD value.
I like to start with a Logarithmic chart, showing us quickly the big picture of what happened and is probable to happen. We can easily draw a red support curve on which the price bounces to the upside. The middle curve in white is a strong level of secondary support.
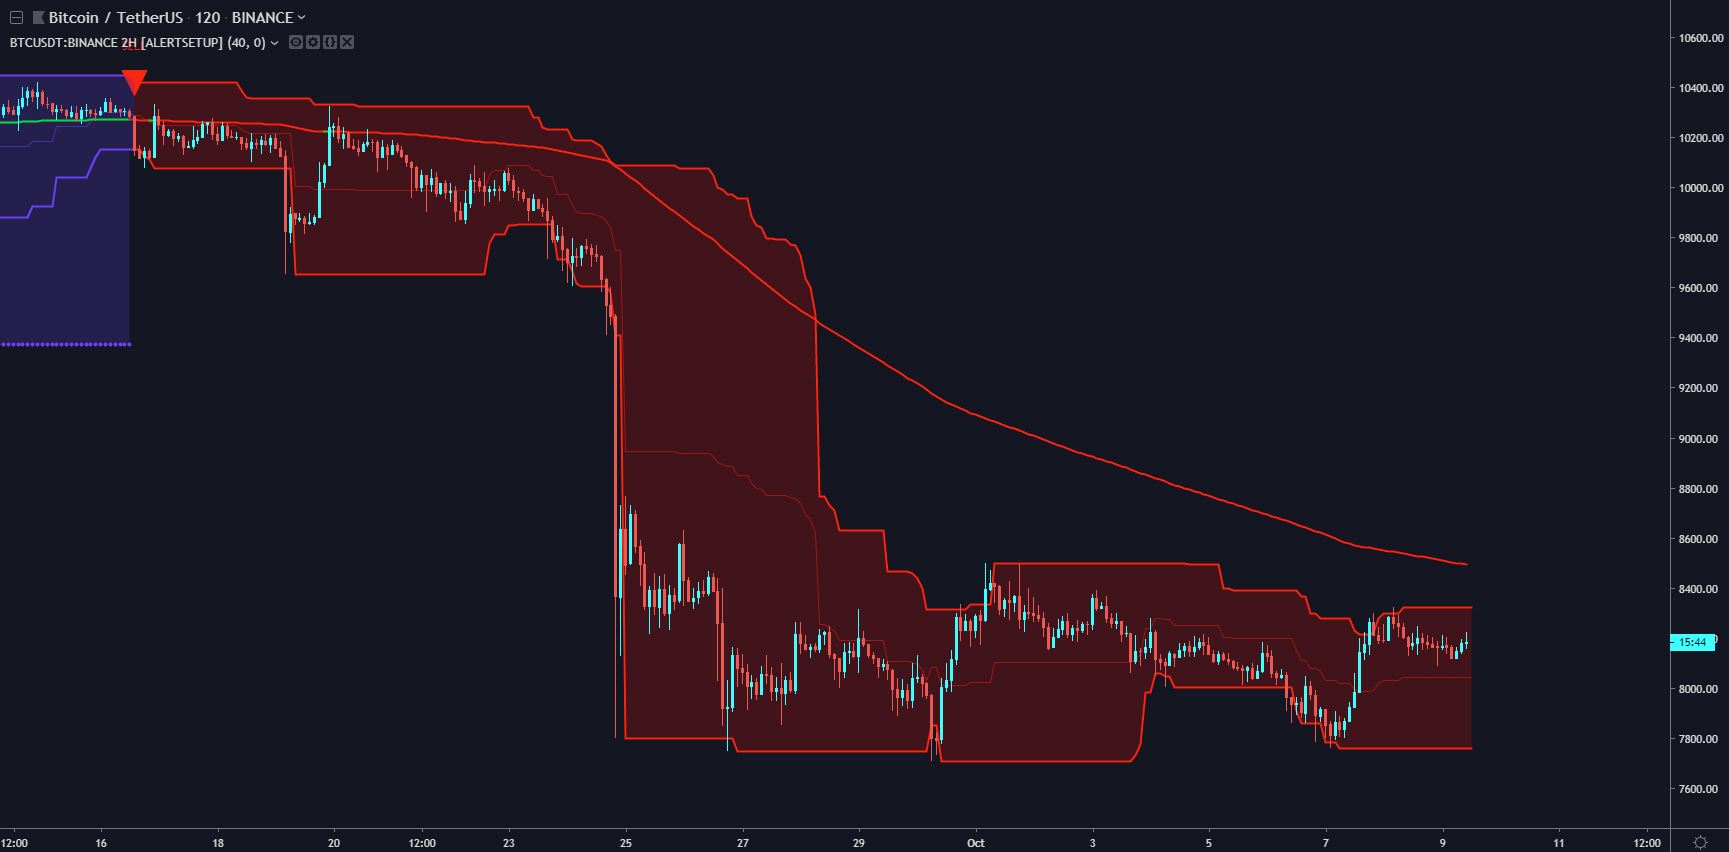
Back to regular charts, with first a look at BINANCE:BTCUSDT
Always keep an eye on the Bitcoin chart since all altcoins are indexed on it. The trend is bearish, and starting to consolidate. Since the price dropped before, there are 66% chances it will drop again, and 33% chances the trend reverses. What interests us when we trade altcoins such as BNB is the following scenario: a major Bitcoin rally, where all the capital would move from altcoins into bitcoin. In this scenario, it is better to get out of alts and go back to bitcoin. But as we saw, it has less than 33% chances to happen right now, and BTC's price can also go up aswell as altcoins going up, but this is rare (2017's last quarter's insanity).
SWING TRADING
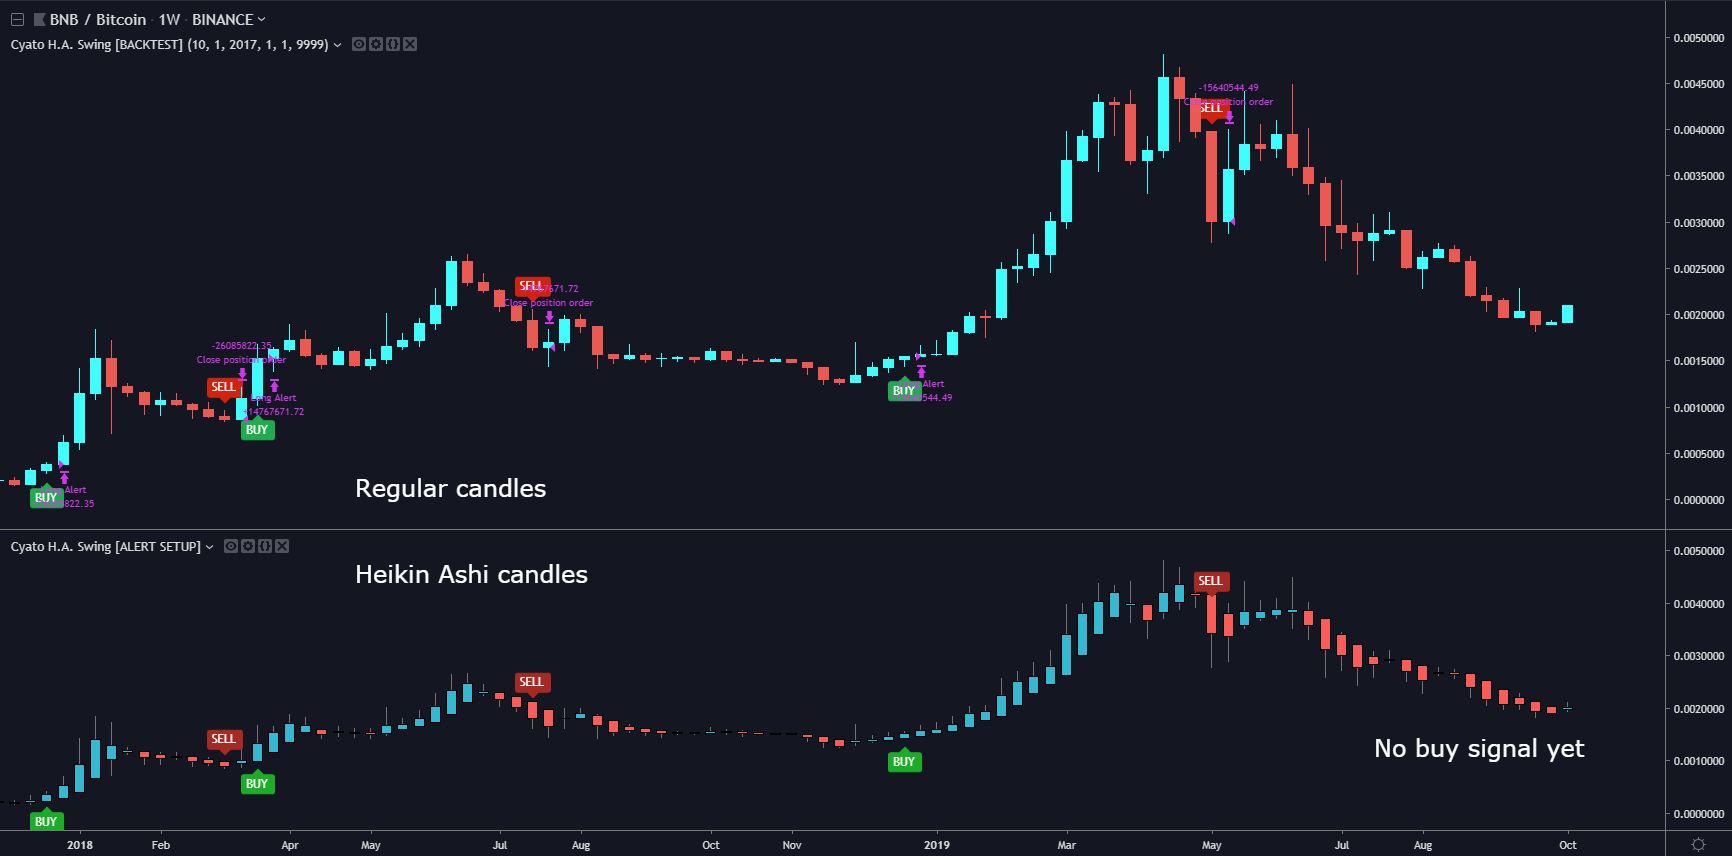
Back to BINANCE:BNBBTC, starting on higher timeframe, in the weekly.
Using my Heikin Ashi Swing Trading Indicator, It looks like a buy signal could happen at the end of the week. I know the price has already gone up ~10%, but as a swing trader we are looking for way more than that, so it is worth to wait the confirmation.
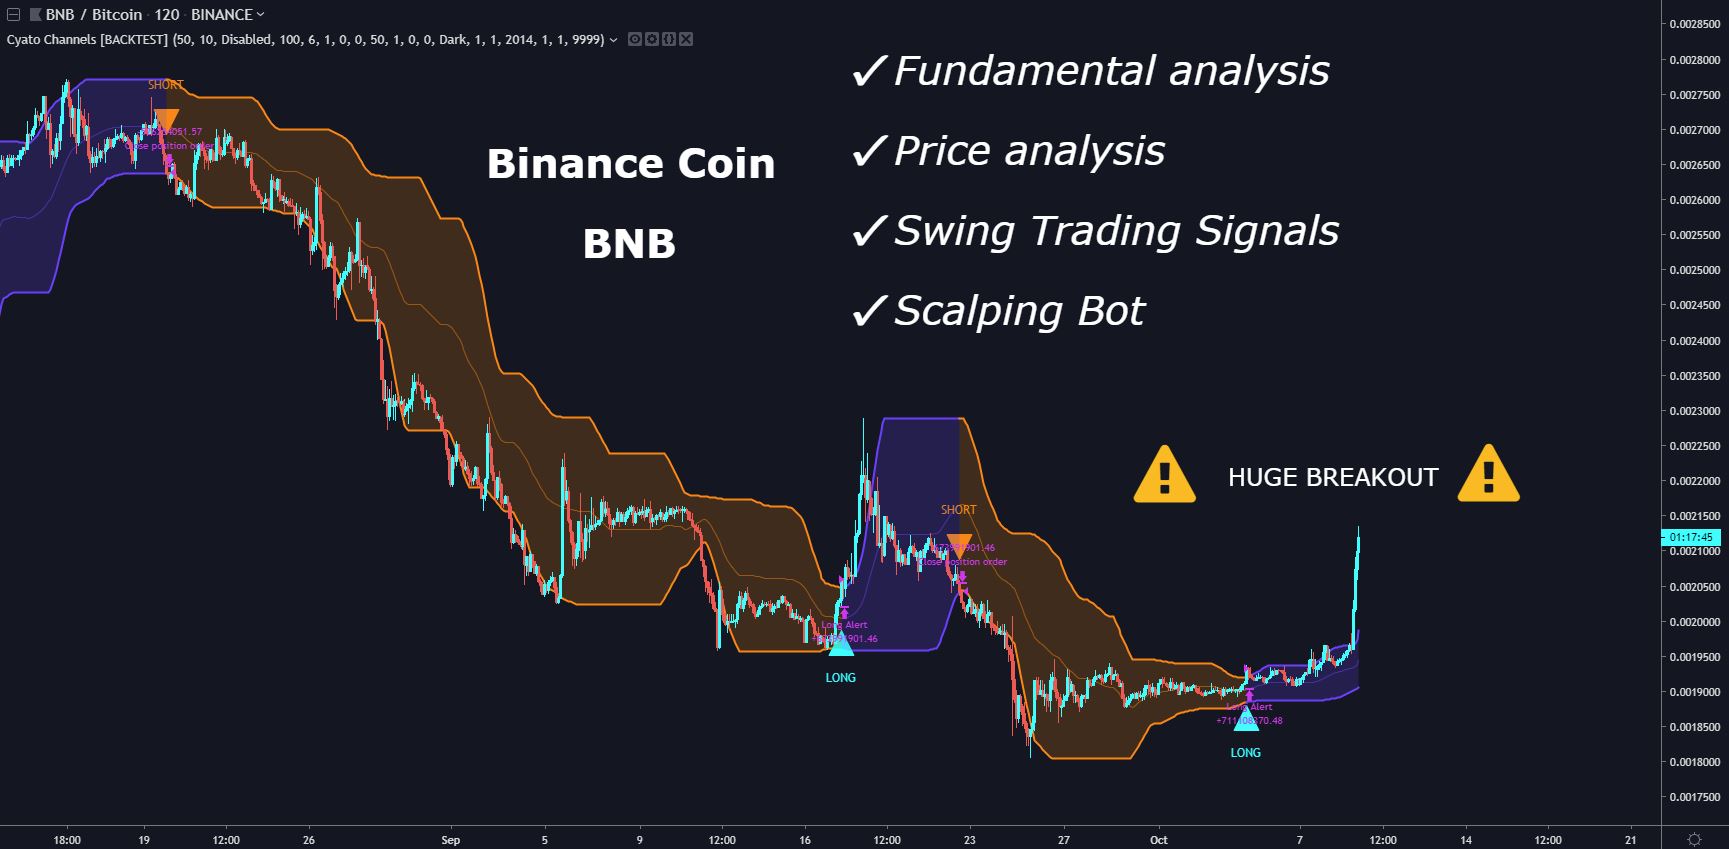
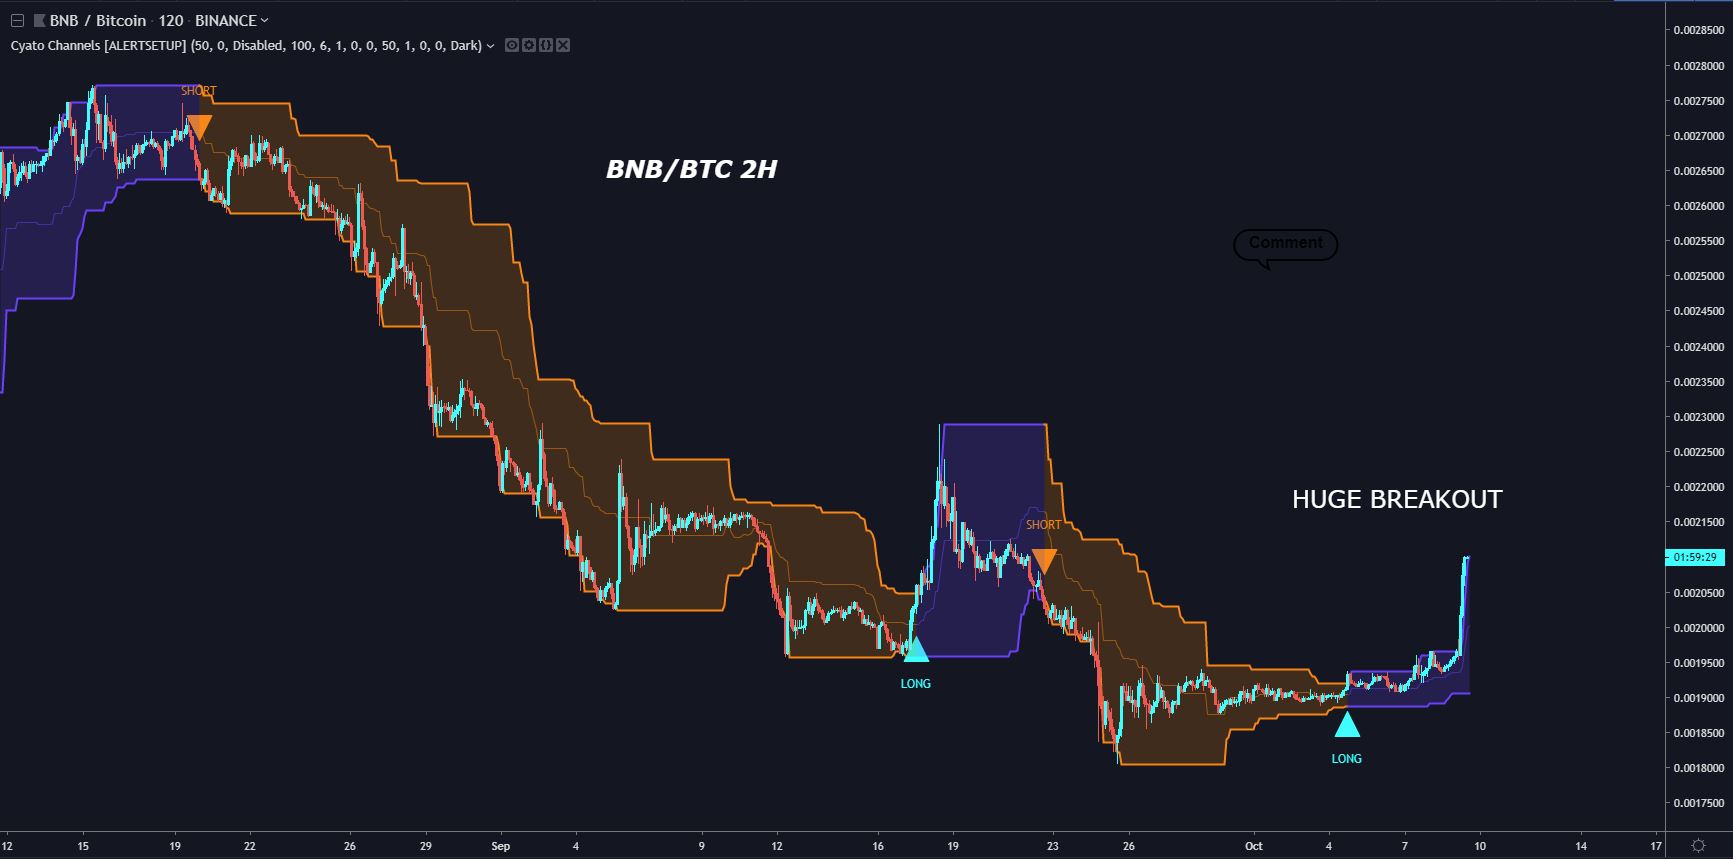
Let's dive in the 2H chart.
A huge breakout just happened, right after a solid consolidation phase, as we can see with my Channels Indicator. In this scenario, if you want to trade in 2H and missed the signal, just jump in the train, put a thight stop loss and profit!
> Start using my indicators for either swing trading or scalping, manually or automated ! <
Thanks for reading!
Written by Cyatophilum - Created 7 years ago - Last edited today
Recent Articles

Introducing the "Trend or Range?" Indicator
Understanding market conditions is a cornerstone of successful trading. Whether you’re trading cryptocurrencies, stocks, or forex, identifying if a market is trending or range-bound can drastically enhance your strategy’s effectiveness. The "Trend or Range?" indicator is here to simplify this process.
What Is the "Trend or Range?" I ...
We are thrilled to announce that short bots are now available!
In this article, we will see why a short bot could be interesting, how it works, and how to trade safely.
Why use a short bot?
Just like a buy and sell bot, the idea of a short bot is to make a profit out of price action, but in a bear market.
For a buy and sell bot, we just need a simple spot trading wallet, ...


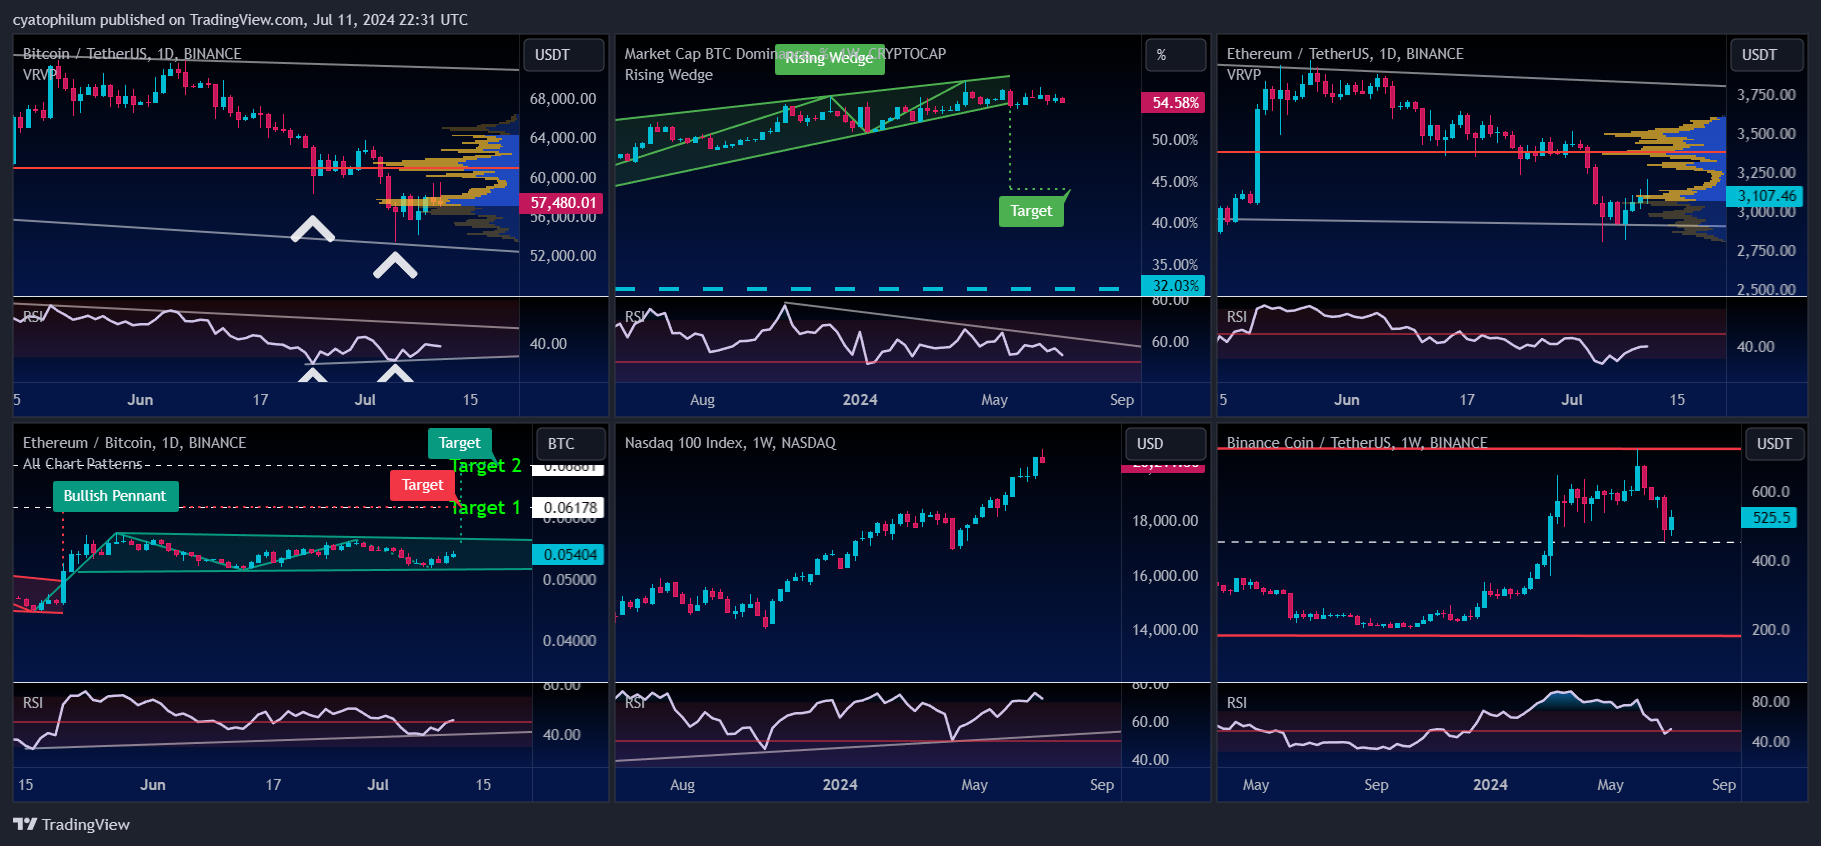
Ethereum is now trading at $2600 and this month saw a lot of volatility but mainly bearish as the price went from above the $3000 level down to the exact 0.236 Fibonacci level at $2130.
The August monthly candle is printing a long lower shadow and the close above or below the 24 months EMA will be crucial to indicate a global trend. It will be 3 bearish candles in a row, which has been the maxi ...
Welcome to our weekly analysis of the cryptocurrency space.
BTC/USDT
The BTCUSDT chart shows Bitcoin trading within a descending channel, with recent price action bouncing off the lower boundary of this channel, indicating potential support around the $53,000 level. The RSI indicates bullish divergence, suggesting a possible trend reversal or a strong bounce from this support level ...