BTC market Swing Strategies
In this article I will show the backtest results of the Cyato H.A. Swing indicator on Binance BTC markets, and make a TOP 8 most profitable coins of 2018-2019.
Most altcoins have been performing badly in 2019 with the bear market, making it hard for a Buy & Sell strategy to be profitable. However I managed to list 20 coins with which the strategy was profitable, and we will see that there are some coins who did surprisingly well.
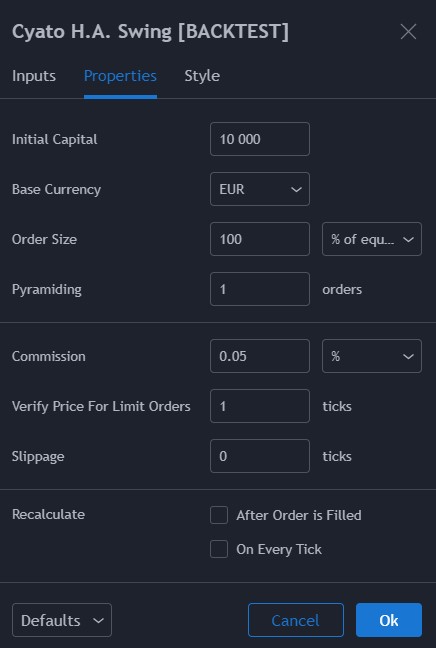
Backtest parameters
To get a clear picture, I backtested all the pairs on the same time period, from the year 2018 in january to today which is the 22th january 2020. The results include only long trades with no leverage, as in successive Buy and Sell orders. The initial capital used for the backtest is 10 000$, and for each trade we use an order size of 100% equity, with a 0.05% commission on each trade.
When backtesting a BTC parity, the Net Profit % is the percentage amount of your BTC equity that you earned during the whole backtest time period. It does not takes the BTC/USD price fluctuations into account.
List
Here is the list ordered by market capitalization.
| Parity BTC | Timeframe | Net Profit % | Max Drawdown % | Nb Trades |
|---|---|---|---|---|
| ETH | 8H | 148 | 29 | 74 |
| EOS | 4D | 54 | 23 | 7 |
| XRP | 4D | 3 | 16 | 4 |
| LTC | 3D | 34 | 19 | 8 |
| BNB | 1D | 73 | 19 | 13 |
| XLM | 8H | 18 | 39 | 89 |
| ADA | 2D | 11 | 40 | 14 |
| TRX | 3D | 238 | 16 | 5 |
| XTZ | 12H | 65 | 13 | 9 |
| LINK | 2D | 382 | 30 | 13 |
| ATOM | 8H | 118 | 27 | 29 |
| ONT | 12H | 542 | 39 | 50 |
| VET | 5D | 85 | 9 | 3 |
| BAT | 2D | 36 | 35 | 12 |
| HOT | 3D | 173 | 8 | 5 |
| WAVES | 1W | 46 | 2 | 2 |
| ZEN | 1D | 70 | 36 | 20 |
| MCO | 1D | 48 | 33 | 26 |
| ENJ | 3D | 308 | 27 | 9 |
| IOST | 4D | 140 | 0 | 3 |
Top 8 Most profitable coins
To get this Top 8, I sorted the list by descending Net Profit %.
| Parity BTC | Timeframe | Net Profit % | Max Drawdown % | Nb Trades |
|---|---|---|---|---|
| ONT | 12H | 542 | 39 | 50 |
| LINK | 2D | 382 | 30 | 13 |
| ENJ | 3D | 308 | 27 | 9 |
| TRX | 3D | 238 | 16 | 5 |
| HOT | 3D | 173 | 8 | 5 |
| ETH | 8H | 148 | 29 | 74 |
| IOST | 4D | 140 | 0 | 3 |
| ATOM | 8H | 118 | 27 | 29 |
In the previous post I backtest the USDT markets..
Thanks for reading!
Written by Cyatophilum - Created 6 years ago - Last edited today
Recent Articles

Introducing the "Trend or Range?" Indicator
Understanding market conditions is a cornerstone of successful trading. Whether you’re trading cryptocurrencies, stocks, or forex, identifying if a market is trending or range-bound can drastically enhance your strategy’s effectiveness. The "Trend or Range?" indicator is here to simplify this process.
What Is the "Trend or Range?" I ...
We are thrilled to announce that short bots are now available!
In this article, we will see why a short bot could be interesting, how it works, and how to trade safely.
Why use a short bot?
Just like a buy and sell bot, the idea of a short bot is to make a profit out of price action, but in a bear market.
For a buy and sell bot, we just need a simple spot trading wallet, ...


Ethereum is now trading at $2600 and this month saw a lot of volatility but mainly bearish as the price went from above the $3000 level down to the exact 0.236 Fibonacci level at $2130.
The August monthly candle is printing a long lower shadow and the close above or below the 24 months EMA will be crucial to indicate a global trend. It will be 3 bearish candles in a row, which has been the maxi ...
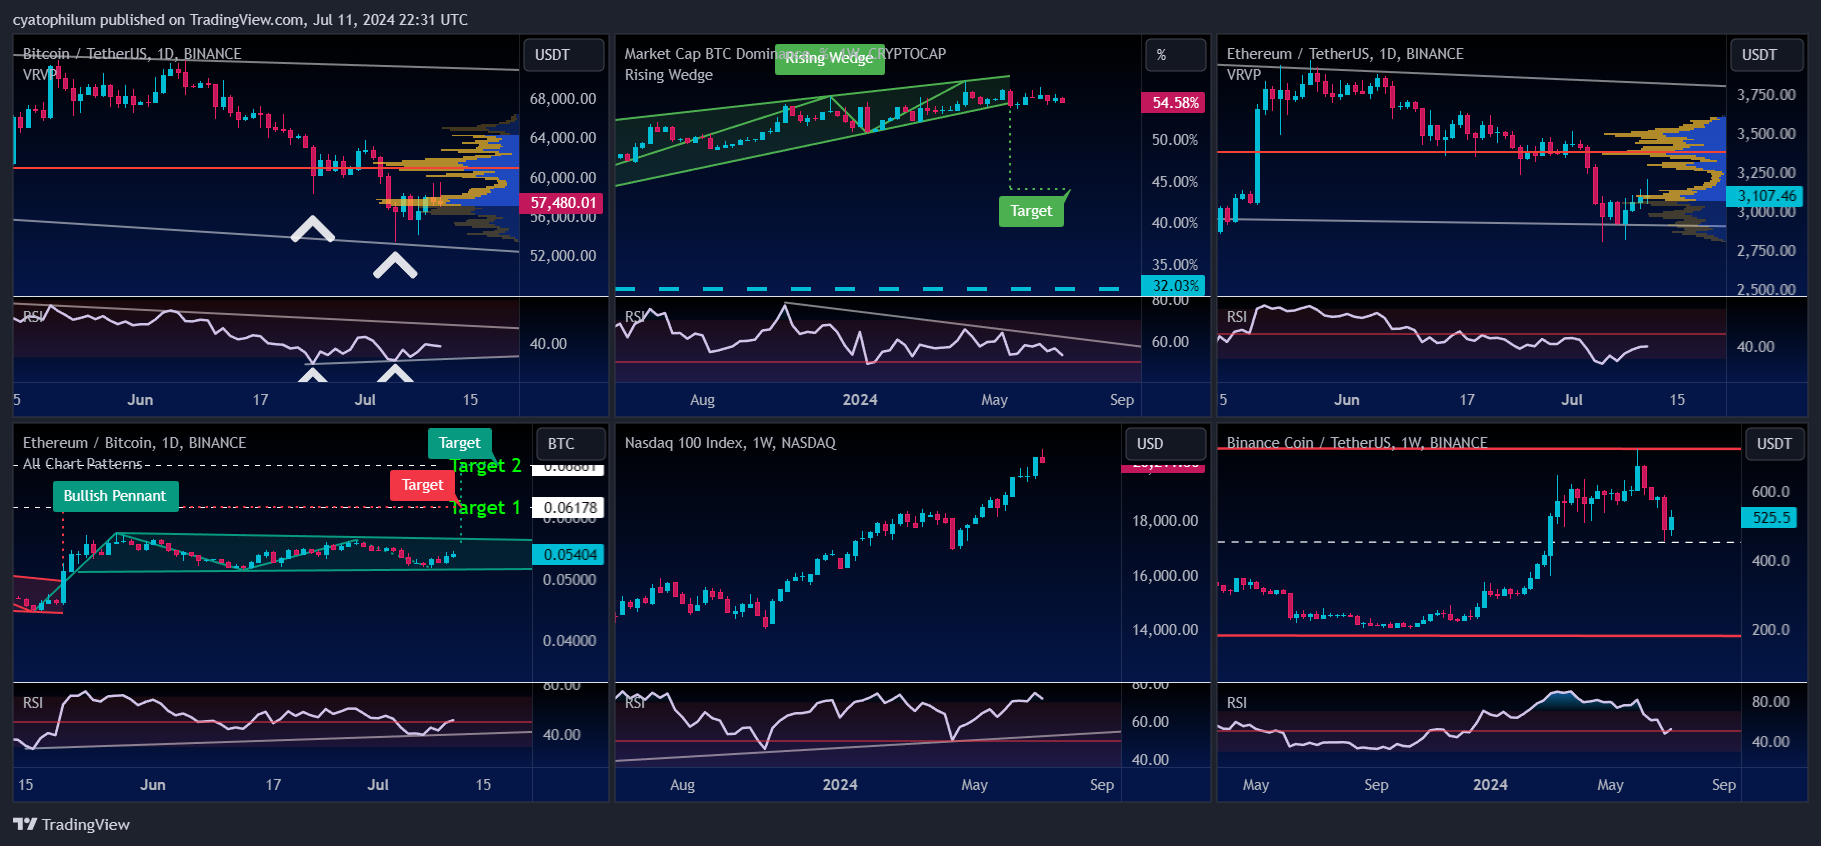
Welcome to our weekly analysis of the cryptocurrency space.
BTC/USDT
The BTCUSDT chart shows Bitcoin trading within a descending channel, with recent price action bouncing off the lower boundary of this channel, indicating potential support around the $53,000 level. The RSI indicates bullish divergence, suggesting a possible trend reversal or a strong bounce from this support level ...